Commons:Featured picture candidates/File:GreaterNottingham-map.png
Jump to navigation
Jump to search

File:GreaterNottingham-map.png, not featured
[edit]
Voting period is over. Please don't add any new votes.Voting period ends on 6 Nov 2010 at 20:33:41 (UTC)
Visit the nomination page to add or modify image notes.

 Info created, uploaded and nominated by MrPanyGoff -- MrPanyGoff (talk) 20:33, 28 October 2010 (UTC)
 Support -- MrPanyGoff (talk) 20:33, 28 October 2010 (UTC)
 Comment - Why is the image so fuzzy and pixelated as if it were softened and upsampled? I also don't see the interest in overlaying those grey shades on the urban areas. -- Alvesgaspar (talk) 10:25, 29 October 2010 (UTC)
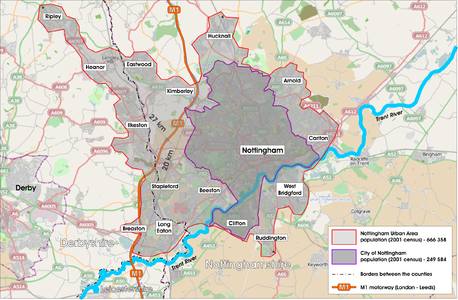
- Almost 100% of the people in the world know about the Paris - the famous French capital. Almost 99 % of the people don't know how big is Paris actually...There are equally spread misleading numbers from 2 milions to 8 millions inhabitants. These two gray shapes gives the answer - in this case about Nottingham. First, these two gray shapes presents what is the difference between the two numbers that are connected with the name of Nottingham - 249,000 and 666,000. Second, these two gray shapes gives the proportion in geometrical way which makes the matter far clearer. And third, these two gray shapes show us the connection between the area and the three most important lines of this place - Trent River, M1 motorway and the county border. I think this scheme is of a high educational value. As for the so called fuzzy background, it is intentionally because it is of secondary importance, even firstly I think the shapes and the three lines to be on white background. --MrPanyGoff (talk) 11:46, 29 October 2010 (UTC)
- Comment -- Drawing a good map is not an easy task! Depending on its purpose, you should start by deciding exactly what kind of information you want to represent, which area is to be covered and in what scale. Only after it is possible to make a rational choice of the specific categories of information to depict and which symbology to use. In the present case, and according to your own comments, most of the information depcited in the background is superfluous and only serves to affect, in a negative way, the legibility of the map. On the other hand the polygons, lines and legend you have added lack the sophistication and accuracy we would expect from a featured illustration. One question: why not add a graphical scale of distances instead of the vectors? -- Alvesgaspar (talk) 18:45, 29 October 2010 (UTC)
- Almost 100% of the people in the world know about the Paris - the famous French capital. Almost 99 % of the people don't know how big is Paris actually...There are equally spread misleading numbers from 2 milions to 8 millions inhabitants. These two gray shapes gives the answer - in this case about Nottingham. First, these two gray shapes presents what is the difference between the two numbers that are connected with the name of Nottingham - 249,000 and 666,000. Second, these two gray shapes gives the proportion in geometrical way which makes the matter far clearer. And third, these two gray shapes show us the connection between the area and the three most important lines of this place - Trent River, M1 motorway and the county border. I think this scheme is of a high educational value. As for the so called fuzzy background, it is intentionally because it is of secondary importance, even firstly I think the shapes and the three lines to be on white background. --MrPanyGoff (talk) 11:46, 29 October 2010 (UTC)
 Oppose - I always found the default color scheme of Open Street Map too pale, but this puts even more grey on the usual bleak background; compare how I brightened my home village (previous versions are in history). /Pieter Kuiper (talk) 17:59, 29 October 2010 (UTC)
Confirmed results: