Commons:Featured picture candidates/Image:Mandelbrot Creation Animation.gif
Jump to navigation
Jump to search
Image:Mandelbrot Creation Animation.gif, not featured
[edit]Original version
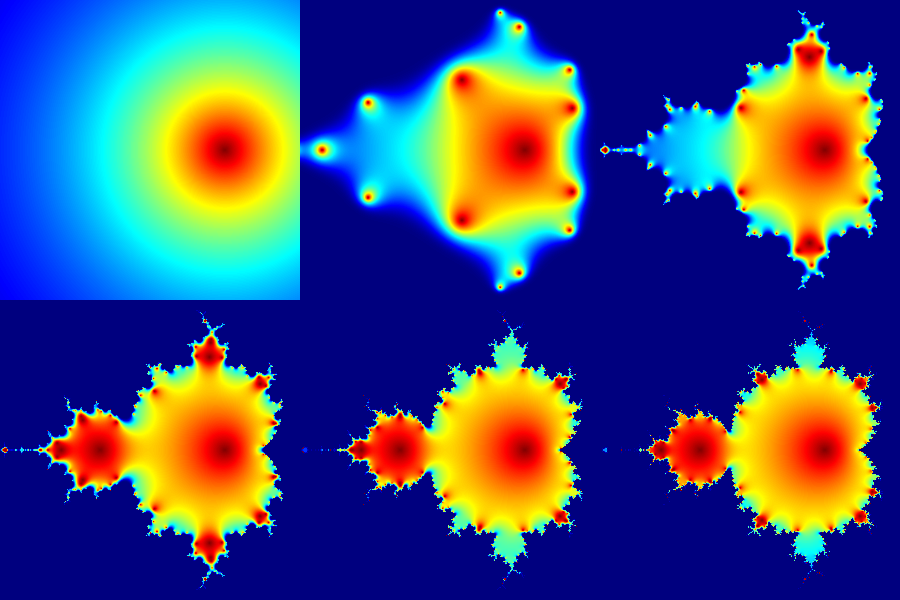
[edit] Info Mandelbrot set: first 20 iterations of equation z = z²+c plotted for different complex constants c. Fractal first studied by Benoît Mandelbrot in 1979. Graphics generated with 13 lines of code in R language. I love the contrast of the complex pattern and the simple-looking math equations that created it, something I was trying to capture in the code. Coded, created, uploaded & nominated by Jarekt --Jarekt 12:22, 16 October 2007 (UTC)
 Support --Jarekt 12:22, 16 October 2007 (UTC)
 Comment I love this but could you redo it at 800 x 600 resolution? The framing is rather tight. Calibas 17:30, 16 October 2007 (UTC)
- done, see above --Jarekt 03:49, 17 October 2007 (UTC)
 Comment - I don't understand the animation. The Mandelbrot set is the inside of the bug-like figure, where the complex equation converges, and it is normally painted black. It is the outside of the figure which is normally represented in various colours, depending on the number of iterations needed for the equation to diverge. Alvesgaspar 20:05, 16 October 2007 (UTC)
- You are referring to so called "escape algorithm" used to produce still images, where color is assigned to number of iterations it took for the equation to diverge to infinity, and black color is used for regions that never diverge. Here I am plotting a much simpler quantity: the actual values of the equation at the first 20 iterations. The deep blue region "squeezing" in the boundaries of the fractal is the diverged region. The colors inside the fractal show how the equation changes at each iteration. I guess you can thing about this plot as the other half of the story from what you usually see. See code for more details. --Jarekt 03:49, 17 October 2007 (UTC)
 Comment - Please separate the nominations! - Alvesgaspar 07:32, 17 October 2007 (UTC)
- done see below--Jarekt 12:13, 17 October 2007 (UTC)
result: 1 support, 0 oppose, 0 neutral => not featured --Laitche 15:04, 30 October 2007 (UTC)
