File:3D PCA of SWE and FIN.gif
From Wikimedia Commons, the free media repository
Jump to navigation
Jump to search

Size of this preview: 799 × 282 pixels. Other resolutions: 320 × 113 pixels | 640 × 226 pixels.
Original file (1,700 × 600 pixels, file size: 6.37 MB, MIME type: image/gif, looped, 180 frames, 18 s)
Note: Due to technical limitations, thumbnails of high resolution GIF images such as this one will not be animated. The limit on Wikimedia Commons is width × height × number of frames ≤ 100 million.
File information
Structured data
Captions
Captions
Add a one-line explanation of what this file represents
| Description3D PCA of SWE and FIN.gif |
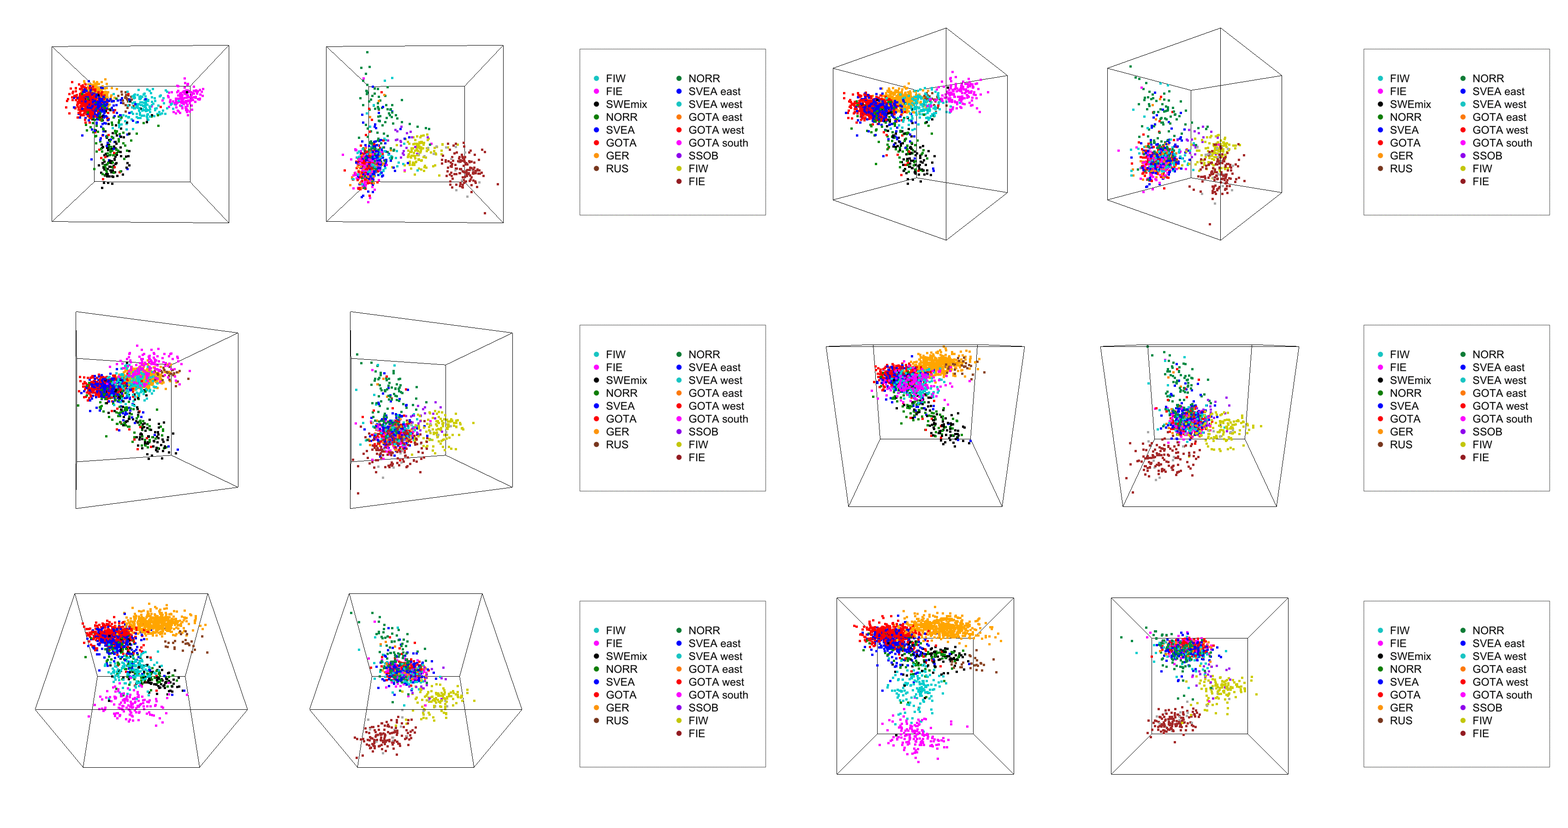
English: Multidimensional scaling plots of genetic distances between individuals in three dimensions. Identity by state distances in Northern Europe (left), and Sweden and Finland (right). The proportions of variance explained by the three axes are 0.64%, 0.24%, and 0.17% in Northern Europe and 1.04%, 0.26%, and 0.24% in Sweden and Finland, respectively. The animation files can be opened e.g. in most internet browsers. Abbreviations as in the Table below.
MediaWiki software sometimes doesn't generate animated thumbnails of very big GIF images. So putting here the GIF file in its original size (1,700 × 600 pixels, 180 frames)  |
| Date | Published: February 9, 2011 |
| Source | Salmela E, Lappalainen T, Liu J, Sistonen P, Andersen PM, Schreiber S, et al. (2011) Swedish Population Substructure Revealed by Genome-Wide Single Nucleotide Polymorphism Data. PLoS ONE 6(2): e16747. doi:10.1371/journal.pone.0016747 http://journals.plos.org/plosone/article?id=10.1371/journal.pone.0016747 |
| Author | Elina Salmela, Tuuli Lappalainen, Jianjun Liu, Pertti Sistonen, Peter M. Andersen, Stefan Schreiber, Marja-Liisa Savontaus, Kamila Czene, Päivi Lahermo, Per Hall, Juha Ker |
| Other versions |
  |
| ID | country | region | Sample size in Dataset 2 | Sample size in Dataset 3 |
| FIW | Western Finland | 137 | 0 | |
| FIE | Eastern Finland | 124 | 0 | |
| SSOB | Swedish-speaking Ostrobothnia | 20 | 0 | |
| SWEmix | Swedes w/o further information | 113 | 0 | |
| NORR | Norrland | 115 | 237 | |
| SVEA | Svealand | 245 | 545 | |
| GOTA | Götaland | 395 | 743 | |
| GER | 492 | 0 | ||
| RUS | 25 | 0 |
|
This file is licensed under the Creative Commons Attribution 2.5 Generic license.
|
This file was published in a Public Library of Science journal. Their website states that the content of all PLOS journals is published under the Creative Commons Attribution 4.0 license (or its previous version depending on the publication date), unless indicated otherwise.
|
File history
Click on a date/time to view the file as it appeared at that time.
| Date/Time | Thumbnail | Dimensions | User | Comment | |
|---|---|---|---|---|---|
| current | 08:33, 11 June 2016 | 1,700 × 600 (6.37 MB) | Was a bee (talk | contribs) | {{Information |Description={{en|1= Multidimensional scaling plots of genetic distances between individuals in three dimensions. Identity by state distances in Northern Europe (left), and Sweden and Finland (right). The proportions of variance explained... |
You cannot overwrite this file.
File usage on Commons
The following 3 pages use this file:
