File:Barabasi Albert model.gif
From Wikimedia Commons, the free media repository
Jump to navigation
Jump to search

Size of this preview: 600 × 600 pixels. Other resolutions: 240 × 240 pixels | 480 × 480 pixels.
Original file (800 × 800 pixels, file size: 255 KB, MIME type: image/gif, looped, 18 frames, 18 s)
File information
Structured data
Captions
Captions
Add a one-line explanation of what this file represents
Summary
[edit]| DescriptionBarabasi Albert model.gif |
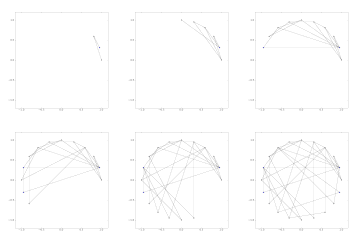
English: The evolution of a network by the Barabasi–Albert model. In every step, one new node appears, and in this case there is two new edges from the new node to the old ones.
Magyar: Egy hálózat fejlődése a Barabási–Albert modell szerint. Minden lépésben egy új csúcs jelenik meg, és ebben a változatban minden új csúcsból két él mutat a régi csúcsokhoz. |
| Date | |
| Source | Created by the NetworkX module of the Python |
| Author | Horváth Árpád |
This plot was created with Matplotlib.
The code is (using the python-networkx and python-matplotlib packages on Ubuntu GNU/Linux distribution):
#! /usr/bin/python
# coding: utf-8

import networkx
#import pylab
from pylab import pi, cos, sin, linspace, array
import matplotlib.pyplot as plt
import os

node_number = 20
initial_nodes = 2
animation = False
animation = True

G=networkx.barabasi_albert_graph(node_number, initial_nodes)

# pos=networkx.graphviz_layout(G, prog="dot")
type="shell4"
pos=networkx.shell_layout(G)
#pos=networkx.graphviz_layout(G,prog='twopi',args=)
print pos

dir=os.path.join("images", type)
if not os.path.isdir(dir):
    os.mkdir(dir)

Ge = networkx.empty_graph(node_number)
#networkx.draw(GG,pos, node_color="w")

for i in range(initial_nodes,node_number):
    nodes = range(i+1)
    GG = G.subgraph(nodes)
    plt.figure(figsize=(8,8))
    networkx.draw(GG,pos, node_color="w", alpha=0.5, node_color="blue", node_size=20, with_labels=False, hold=False)
    #networkx.draw(Ge,pos, node_color="w", alpha=0.5, node_color="blue", node_size=20, with_labels=False, hold=True)
    #nx.draw(G,pos,node_size=20,alpha=0.5,node_color="blue", with_labels=False)
    xmax=max(xx for xx,yy in pos.values())
    xmin=min(xx for xx,yy in pos.values() + [(0,0)])
    ymax=max(yy for xx,yy in pos.values())
    ymin=min(yy for xx,yy in pos.values() + [(0,0)])
    dx = xmax - xmin
    ddx=0.1*dx
    dy = ymax - ymin
    ddy=0.1*dy
    plt.xlim(xmin-ddx,xmax+ddx)
    plt.ylim(ymin-ddy,ymax+ddy)
    plt.savefig("%s/barabasi_%s%02d.png" % (dir, type, i))

if animation:
    input = os.path.join(dir, "*.png")
    output = os.path.join(dir, "barabasi_albert.gif")
    os.system("convert -delay 100 -loop 0 %s %s" % (input, output))
(If someone knows how to eliminate the frame around the network, write to me, please.)
Licensing
[edit]I, the copyright holder of this work, hereby publish it under the following licenses:

|
Permission is granted to copy, distribute and/or modify this document under the terms of the GNU Free Documentation License, Version 1.2 or any later version published by the Free Software Foundation; with no Invariant Sections, no Front-Cover Texts, and no Back-Cover Texts. A copy of the license is included in the section entitled GNU Free Documentation License.http://www.gnu.org/copyleft/fdl.htmlGFDLGNU Free Documentation Licensetruetrue |
This file is licensed under the Creative Commons Attribution-Share Alike 3.0 Unported license.
- You are free:
- to share – to copy, distribute and transmit the work
- to remix – to adapt the work
- Under the following conditions:
- attribution – You must give appropriate credit, provide a link to the license, and indicate if changes were made. You may do so in any reasonable manner, but not in any way that suggests the licensor endorses you or your use.
- share alike – If you remix, transform, or build upon the material, you must distribute your contributions under the same or compatible license as the original.
You may select the license of your choice.
File history
Click on a date/time to view the file as it appeared at that time.
| Date/Time | Thumbnail | Dimensions | User | Comment | |
|---|---|---|---|---|---|
| current | 08:44, 20 July 2011 |  | 800 × 800 (255 KB) | 52Dora (talk | contribs) | 囧rz被耍了... |
| 08:43, 20 July 2011 |  | 800 × 800 (296 KB) | 52Dora (talk | contribs) | 最新版本的GIF根本就没有动 | |
| 13:20, 29 January 2009 |  | 800 × 800 (255 KB) | Harp (talk | contribs) | Without frame (without plt.frame("equal") | |
| 22:02, 28 January 2009 |  | 800 × 800 (296 KB) | Harp (talk | contribs) | {{Information |Description={{en|1=The evolution of a graph by the Barabasi Albert model. In every step, one new node appears, and in this case there is two new edges from the new node to the old ones. }} {{hu|1=Egy gráf fejlődése a Barabási-Albert mod |
You cannot overwrite this file.
File usage on Commons
There are no pages that use this file.
File usage on other wikis
The following other wikis use this file:
- Usage on az.wikipedia.org
- Usage on bn.wikipedia.org
- Usage on de.wikipedia.org
- Usage on en.wikipedia.org
- Usage on en.wikibooks.org
- Usage on fa.wikipedia.org
- Usage on fr.wikipedia.org
- Usage on he.wikipedia.org
- Usage on hu.wikipedia.org
- Usage on ja.wikipedia.org
- Usage on meta.wikimedia.org
- Usage on mk.wikipedia.org
- Usage on ru.wikipedia.org
- Usage on sr.wikipedia.org
- Usage on uk.wikipedia.org
- Usage on zh.wikipedia.org