File:BrownscheBewegung.png
Jump to navigation
Jump to search

Size of this preview: 800 × 600 pixels. Other resolutions: 320 × 240 pixels | 640 × 480 pixels | 1,024 × 768 pixels | 1,280 × 960 pixels | 1,600 × 1,200 pixels.
Original file (1,600 × 1,200 pixels, file size: 23 KB, MIME type: image/png)
Captions
Captions
Add a one-line explanation of what this file represents
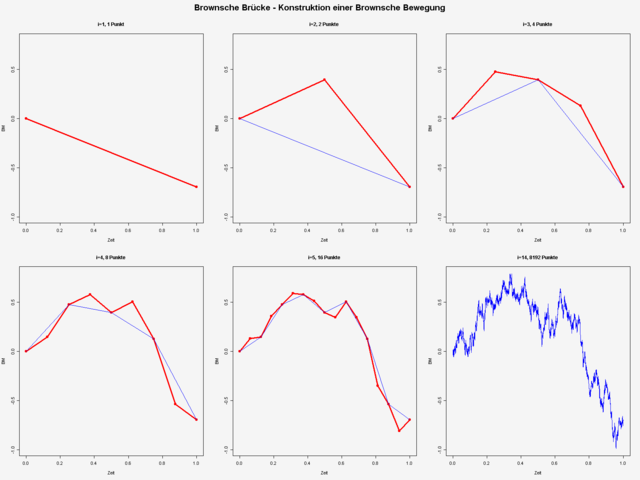
| Description | Algorithmische Konstruktion der Brownschen Bewegung als Summe von normalverteilten Zufallsgrößen |
| Date | |
| Source | selbst erstellt mit de:GNU R. |
| Author | Thomas Steiner |
| Permission (Reusing this file) |
Thomas Steiner put it under the GFDL |
| Other versions | de:Bild:BrownscheBewegung.png |

|
Permission is granted to copy, distribute and/or modify this document under the terms of the GNU Free Documentation License, Version 1.2 or any later version published by the Free Software Foundation; with no Invariant Sections, no Front-Cover Texts, and no Back-Cover Texts. A copy of the license is included in the section entitled GNU Free Documentation License. |
| This file is licensed under the Creative Commons Attribution-Share Alike 3.0 Unported license. | ||
| ||
| This licensing tag was added to this file as part of the GFDL licensing update. |
R-Quelltext:
set.seed(303898)
H=14                         #Anzahl der Halbierungsschritte
if (exists("B")) {           #nach dem ersten Durchlauf als Variable vorhanden
  mBM=range(B)               #max und min der BM, für ylim des plots;
} else {
  mBM=c(-1, 0.8)
}

B=array(data=0,dim=2)        #Startpunkt der Brownschen Bewegung
B[2]=rnorm(n=1, mean=0, sd=1)
png(filename = "BrownscheBewegung.png", width=1600, height=1200, pointsize=12)
par(mfrow = c(2,3), oma = c(0,0,3,0), bg="whitesmoke")
plot(x=seq(from=0,to=1,length=2), y=B, type="o", col="red", xlab="Zeit", ylab="BM", ylim=mBM, lwd=3)
title(main="i=1, 1 Punkt",cex.main=1.1)
for (i in 2:H) {   #iteriere über jede Halbierung
  old=B
  for (t in 1:2^(i-2)) {  #für jeden alten Zeitpunkt gibt es zwei neue (außer dem letzten)
    B[2*t-1] = old[t]
    B[2*t]   = rnorm(n=1, mean=0.5*(old[t]+old[t+1]), sd=1/(sqrt(2)^i) )
  }
  B[2^(i-1)+1]=old[2^(i-2)+1]     # letzter Zeitpunkt
  if (i<6) {#zeichne nur die ersten 5
    plot(x=seq(from=0,to=1,length=2^(i-1)+1),y=B,type="o",col="red",xlab="Zeit",ylab="BM",ylim=mBM,lwd=3)
    points(x=seq(from=0,to=1,length=2^(i-2)+1),y=old,type="l",col="blue")
    title(main=paste("i=",i,", ",2^(i-1)+1-1," Punkte",sep=""),cex.main=1.1)
  }
  Sys.sleep(0.4)     # um es quasi "live" in R zu sehen: "png()" und "dev.off()" auskommentieren!
}
plot(x=seq(from=0,to=1,length=2^(H-1)+1),y=B,type="l",col="blue",xlab="Zeit",ylab="BM",ylim=mBM,lwd=1)
title(main=paste("i=",H,", ",2^(H-1)+1-1," Punkte",sep=""),cex.main=1.1)
title(main="Brownsche Brücke - Konstruktion einer Brownsche Bewegung", cex.main=2, outer=TRUE)
dev.off()
File history
Click on a date/time to view the file as it appeared at that time.
| Date/Time | Thumbnail | Dimensions | User | Comment | |
|---|---|---|---|---|---|
| current | 11:38, 27 May 2006 | | 1,600 × 1,200 (23 KB) | Thire (talk | contribs) | {{Information| |Description = Algorithmische Konstruktion der Brownschen Bewegung als Summe von normalverteilten Zufallsgrößen |Source = selbst erstellt mit de:GNU R. |Date = 27 may 2006 |Author = Thomas Steiner |Permission = |
You cannot overwrite this file.
File usage on Commons
There are no pages that use this file.
File usage on other wikis
The following other wikis use this file:
- Usage on de.wikipedia.org
- Usage on de.wikibooks.org