File:Centers8.png
Jump to navigation
Jump to search
Size of this preview: 752 × 599 pixels. Other resolutions: 301 × 240 pixels | 602 × 480 pixels | 1,000 × 797 pixels.
Original file (1,000 × 797 pixels, file size: 781 KB, MIME type: image/png)
Captions
Captions
Add a one-line explanation of what this file represents
Summary
[edit]
| Description |
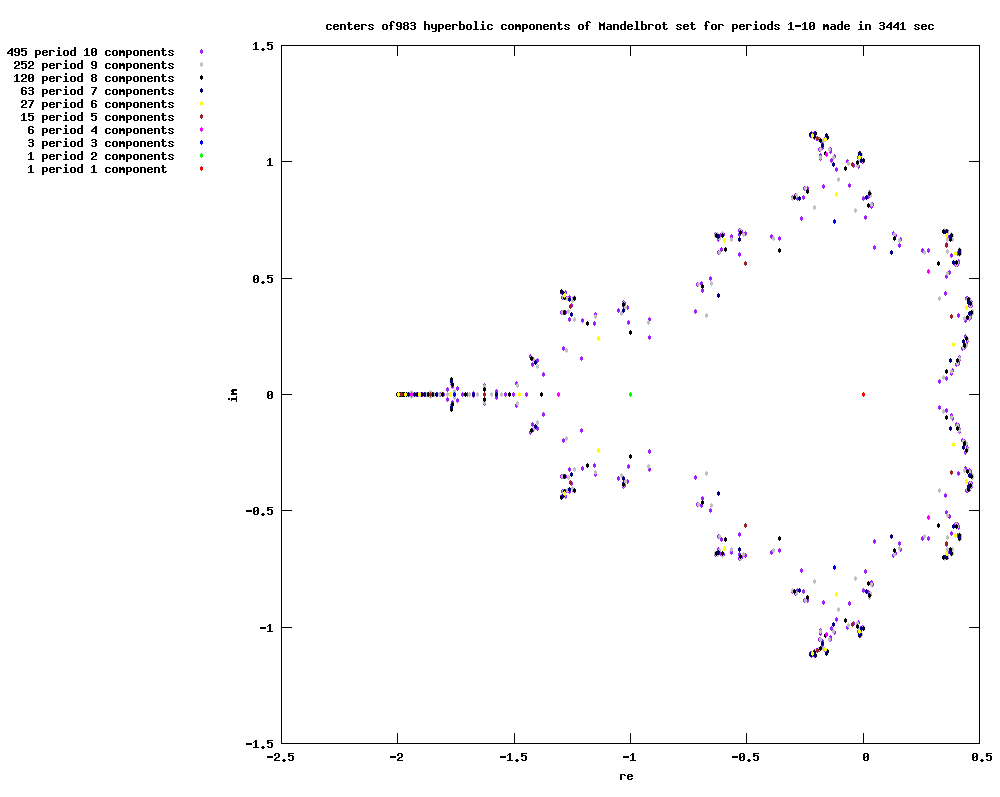
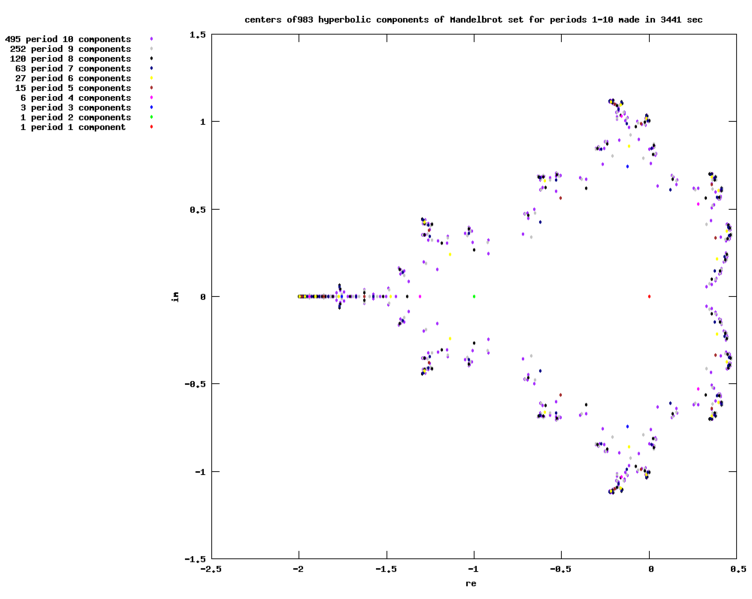
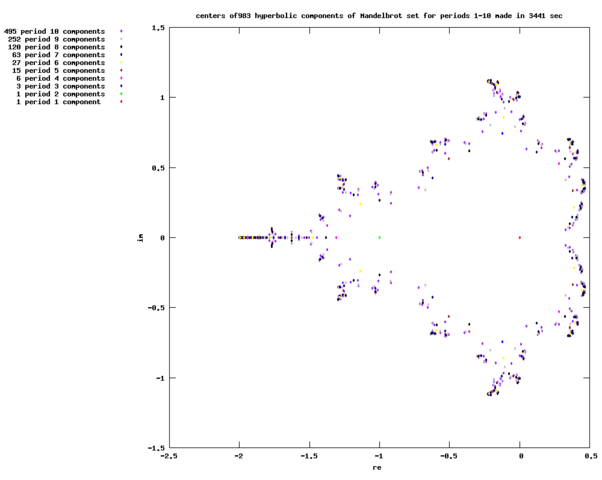
English: Centers of 983 hyperbolic components of Mandelbrot set with respect to complex quadratic polynomial for period 1-10
Polski: Punkty centralne 983 składowych zbioru Mandelbrota dla okresów 1-10
This plot was created with Gnuplot by n. |
| Date | 4.01.2009 |
| Source | Own work |
| Author | Adam majewski |
Long description
[edit]
Program input
[edit]
No input is needed
Program output
[edit]
- png file : centers_9_new.png
- txt files with numerical values of centers in big float Maxima format ( one file for each period)
Parts of the program
[edit]
- definition of functions and constants
- loading packages
- for periods 1-period_Max
- computation of irreducible polynomials for each period
- computation of centers for each period : centers[period]
- saving centers to text files : centers_bf_p.txt
- computes number of centers for each period ( l[period]) and for all periods 1-period_Max ( N_of_centers)
- drawing to centers_9_new.png file
Software needed
[edit]
- Maxima CAS
- cpoly package written in Lisp by Raymond Toy containing bfallroots function finding roots of complex polynomials by Jenkins-Traub algorithm. It is in file cpoly.lisp in src directory ( for example in Maxima-5.16.3\share\maxima\5.16.3\src )
- draw package - Maxima-Gnuplot interface by Mario Rodriguez Riotorto archive copy at the Wayback Machine
- gnuplot for drawing ( creates png file )
Tested on versions:
- wxMaxima 0.7.6
- Maxima 5.16.3
- Lisp GNU Common Lisp (GCL) GCL 2.6.8 (aka GCL)
- Gnuplot Version 4.2 patchlevel 3
Algorithm
[edit]
See Wikibooks for detailes
Questions
[edit]
- Can it be done for higher periods ? For me (GCL and wxMaxima) it fails for period 10 and precision[1] fpprec:150 or 256, but for period 10 and fpprec:300 I can run it from console or XMaxima, not wxMaxima
- How to save it as svg file ?
Compare with :
[edit]
- centers 1-12 archive copy at the Wayback Machine made with Maxima, Eigensolve and Gnuplot
- centers of period 10 made with MPSolve and Gnuplot
- http://math.stackexchange.com/questions/2205922/critical-polynomial-roots-bigger-than-2
Maxima CAS src code
[edit]
 /*
 Maxima batch script
 because :
 "this does works in the console and xMaxima, but not in wxMaxima " Julien B. O. - jul059
 http://sourceforge.net/tracker/index.php?func=detail&aid=1571099&group_id=4933&atid=104933
 handling of large factorials
 for periods >=10 run from console or XMaxima, not wxMaxima
 for example from console under windows run:
 cd C:\Program Files\Maxima-5.16.3\bin
 maxima
 batch("D:/doc/programming/maxima/batch/MandelbrotCenters/mset_centers_10_new_png.mac")$
 ----------------
 notation and idea is based on paper :
 V Dolotin , A Morozow : On the shapes of elementary domains or why Mandelbrot set is made from almost
 ideal   circles ?
 */
 start:elapsed_run_time ();
 load(cpoly);
 period_Max:10;


/* basic funtion  = monic and centered complex quadratic polynomial
 http://en.wikipedia.org/wiki/Complex_quadratic_polynomial
 */
 f(z,c):=z*z+c $

/* iterated function */
 fn(n, z, c) :=
  if n=1 	then f(z,c)
  else f(fn(n-1, z, c),c) $

 /* roots of Fn are periodic point of  fn function */
 Fn(n,z,c):=fn(n, z, c)-z $

/* gives irreducible divisors of polynomial Fn[p,z=0,c] */
 GiveG[p]:=
 block(
 [f:divisors(p),t:1],
 g,
 f:delete(p,f),
 if p=1
 then return(Fn(p,0,c)),
 for i in f do t:t*GiveG[i],
 g: Fn(p,0,c)/t,
 return(ratsimp(g))
  )$

 /* use :
 load(cpoly);
 roots:GiveRoots_bf(GiveG[3]);
 */
 GiveRoots_bf(g):=
 block(
 [cc:bfallroots(expand(%i*g)=0)],
 cc:map(rhs,cc),/* remove string "c=" */
 return(cc)
  )$

GiveCenters_bf(p):=
 block(
 [g,
 cc:[]],
 fpprintprec:10, /* number of digits to display */
 if p<7 then fpprec:16
 elseif p=7 then fpprec:32
 elseif p=8 then fpprec:64
 elseif p=9 then fpprec:128
 elseif p=10 then fpprec:300,
 g:GiveG[p],
 cc:GiveRoots_bf(g),
 return(cc)
 );
 N_of_centers:0;
 for period:1 thru period_Max step 1 do
 (
 centers[period]:GiveCenters_bf(period), /* compute centers */

/* save output to file as Maxima expressions */
 stringout(concat("centers_bf_",string(period),".txt"),centers[period]),
 l[period]: length(centers[period]),
 N_of_centers:N_of_centers+l[period]
 );

stop:elapsed_run_time ();
 time:fix(stop-start);


load(draw);

draw2d(
 file_name = "centers_10_new",
 terminal  = 'png,
 pic_width=1000,
 pic_height= 1000,
 yrange = [-1.5,1.5],
 xrange = [-2.5,0.5],
 title= concat("centers of ",string(N_of_centers)," hyperbolic components of Mandelbrot set for periods 1- ",string(period_Max)," made in ",string(time)," sec"),
 user_preamble="set size square;set key out;set key top left",
 xlabel     = "re ",
 ylabel     = "im",
 point_type    = filled_circle,
 points_joined = false,
 point_size    = 0.5,
 /* in reversed order of periods because number of centers is proportional to period */
 key = concat(string(l[10])," period 10 components"),
 color		  =purple,
 points(map(realpart, centers[10]),map(imagpart, centers[10])),
 key = concat(string(l[9])," period 9 components"),
 color		  =gray,
 points(map(realpart, centers[9]),map(imagpart, centers[9])),
 key = concat(string(l[8])," period 8 components"),
 color		  =black,
 points(map(realpart, centers[8]),map(imagpart, centers[8])),
 key = concat(string(l[7])," period 7 components"),
 color		  =navy,
 points(map(realpart, centers[7]),map(imagpart, centers[7])),
 key = concat(string(l[6])," period 6 components"),
 color		  =yellow,
 points(map(realpart, centers[6]),map(imagpart, centers[6])),
 key = concat(string(l[5])," period 5 components"),
 color		  =brown,
 points(map(realpart, centers[5]),map(imagpart, centers[5])),
 key = concat(string(l[4])," period 4 components"),
 color		  =magenta,
 points(map(realpart, centers[4]),map(imagpart, centers[4])),
 key = concat(string(l[3])," period 3 components"),
 color		  =blue,
 points(map(realpart, centers[3]),map(imagpart, centers[3])),
 key = concat(string(l[2])," period 2 components"),
 color		  =green,
 points(map(realpart, centers[2]),map(imagpart, centers[2])),
 key = concat(string(l[1])," period 1 component "),
 color		  =red,
 points(map(realpart, centers[1]),map(imagpart, centers[1]))
 )$
References
[edit]
Licensing
[edit]
I, the copyright holder of this work, hereby publish it under the following licenses:
This file is licensed under the Creative Commons Attribution-Share Alike 3.0 Unported license.
- You are free:
- to share – to copy, distribute and transmit the work
- to remix – to adapt the work
- Under the following conditions:
- attribution – You must give appropriate credit, provide a link to the license, and indicate if changes were made. You may do so in any reasonable manner, but not in any way that suggests the licensor endorses you or your use.
- share alike – If you remix, transform, or build upon the material, you must distribute your contributions under the same or compatible license as the original.

|
Permission is granted to copy, distribute and/or modify this document under the terms of the GNU Free Documentation License, Version 1.2 or any later version published by the Free Software Foundation; with no Invariant Sections, no Front-Cover Texts, and no Back-Cover Texts. A copy of the license is included in the section entitled GNU Free Documentation License. |
You may select the license of your choice.
File history
Click on a date/time to view the file as it appeared at that time.
| Date/Time | Thumbnail | Dimensions | User | Comment | |
|---|---|---|---|---|---|
| current | 10:02, 6 May 2017 | | 1,000 × 797 (781 KB) | Shiftchange (talk | contribs) | Cropped white space above and below image. |
| 13:24, 30 March 2009 |  | 1,000 × 1,000 (13 KB) | Soul windsurfer (talk | contribs) | centers for periods 1-10 | |
| 13:53, 15 March 2009 |  | 1,000 × 1,000 (10 KB) | Soul windsurfer (talk | contribs) | periods 1-9 | |
| 12:33, 4 January 2009 |  | 1,000 × 1,000 (9 KB) | Soul windsurfer (talk | contribs) | {{Information |Description={{en|1=Centers of hyperebolic components of Mandelbrot set with respect to complex quadratic polynomial for period 1-8 }} {{pl|1=Punkty centralne składowych zbioru Mandelbrota dla okresów 1-8 }} |Source=Own work |Author=[[User |
You cannot overwrite this file.
File usage on Commons
There are no pages that use this file.
File usage on other wikis
The following other wikis use this file:
- Usage on el.wikipedia.org
- Usage on en.wikipedia.org
- Usage on en.wikibooks.org
- Usage on pl.wikipedia.org