File:Co2-temperature-records.svg
Jump to navigation
Jump to search

Size of this PNG preview of this SVG file: 720 × 540 pixels. Other resolutions: 320 × 240 pixels | 640 × 480 pixels | 1,024 × 768 pixels | 1,280 × 960 pixels | 2,560 × 1,920 pixels.
Original file (SVG file, nominally 720 × 540 pixels, file size: 225 KB)
Captions
Captions
Add a one-line explanation of what this file represents
Summary
[edit]| Description |
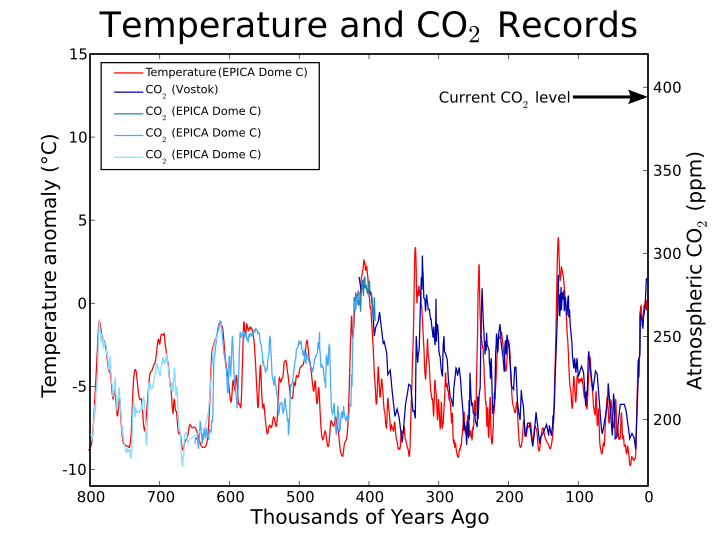
English: This figure shows historical carbon dioxide (right axis) and reconstructed temperature (as a difference from the mean temperature for the last 100 years) records based on Antarctic ice cores, providing data for the last 800,000 years.
This figure was produced by Leland McInnes using python and matplotlib and is licensed under the GFDL. All data is from publicly available sources.
|
| Date | |
| Source | Own work (Own work) |
| Author | Leland_McInnes (talk) (Uploads) |
| Other versions |
|
.png)
![CO2 at Mauna Loa since 1958. [1] [2]](/wiki/File:Co2maunaloa2003.png)

![]] and greenhouse gases during 420,000 years.](/wiki/File:Vostok_420ky_4curves_insolation.jpg)


Source code
[edit]
The image was created with the following script, making use of the matplotlib library.
# -*- coding: utf-8 -*-
import numpy as np
import matplotlib.pylab as plt
from matplotlib.font_manager import FontProperties
def smooth(signal, window_size):
extended_signal = signal[window_size:0:-1] + signal + signal[-1:-window_size:-1]
s = np.array(extended_signal)
w = np.hamming(window_size)
y = np.convolve(w/w.sum(), s, mode="same")
return y[window_size:-window_size+1]

temp_file = open("EDC_dD_temp_estim.csv")
data_rows = [x.split() for x in temp_file if not x.startswith("#") and len(x.split()) == 5]
temp_years = [float(x[1]) for x in data_rows]
raw_temp_vals = [float(x[3]) for x in data_rows]
temp_vals = list(smooth(raw_temp_vals[:4000], 50)) + list(smooth(raw_temp_vals[4000:6000], 10)) + raw_temp_vals[6000:]
co2_file1 = open("Vostok_CH4_CO2_age.csv")
data_rows = [x.split("\t") for x in co2_file1 if not x.startswith('"')]
co2_years1 = [float(x[0]) for x in data_rows if x[2] != "\n"]
co2_vals1 = [float(x[2].strip()) for x in data_rows if x[2] != "\n"]
co2_file2 = open("EDC_CO2_423-391_kyr_BP.csv")
data_rows = [x.split() for x in co2_file2 if not x.startswith('"')]
co2_years2 = [float(x[1]) for x in data_rows]
co2_vals2 = [float(x[2]) for x in data_rows]
co2_file3 = open("EDC_CO2_650-413_kyr_BP.csv")
data_rows = [x.split() for x in co2_file3 if not x.startswith('"')]
co2_years3 = [float(x[1]) for x in data_rows]
co2_vals3 = [float(x[2]) for x in data_rows]
co2_file4 = open("EDC99_CO2_bern.csv")
data_rows = [x.split() for x in co2_file4 if x.startswith("3")]
co2_years4 = [float(x[1]) for x in data_rows]
co2_vals4 = [float(x[2]) for x in data_rows]
plt.title("Temperature and CO$_2$ Records", size=28)
temp_ax = plt.axes()
temp_ax.yaxis.tick_left()
tline = plt.plot(temp_years, temp_vals, "red")
plt.ylabel(u"Temperature anomaly (°C)", size=16)
plt.xlabel("Thousands of Years Ago", size=16)
plt.xlim(800,0)
plt.ylim(-11,15)
co2_ax = plt.axes([0.125,0.1,0.775,0.8], frameon=False)
co2_ax.yaxis.tick_right()
co2_ax.yaxis.set_label_position("right")
plt.xticks([])
cline1 = plt.plot(co2_years1, co2_vals1, "#0000AA")
cline2 = plt.plot(co2_years2, co2_vals2, "#2288AA")
cline3 = plt.plot(co2_years3, co2_vals3, "#44AAFF")
cline4 = plt.plot(co2_years4, co2_vals4, "#88DDFF")
plt.ylabel("Atmospheric CO$_2$ (ppm)", size=16)
plt.xlim(800,0)
plt.ylim(160,420)
plt.annotate("Current CO$_2$ level", (2,386.36), (300,386.36), xycoords="data", arrowprops=dict(arrowstyle="->"))
plt.legend((tline, cline1, cline2, cline3, cline4), ("Temperature (EPICA Dome C)", "CO$_2$ (Vostok)", "CO$_2$ (EPICA Dome C)", "CO$_2$ (EPICA Dome C)", "CO$_2$ (EPICA Dome C)"), "upper left", prop=FontProperties(size=9), pad=0.1, handletextsep=0.005)
plt.savefig("py-co2-temp.svg")
plt.show()
Licensing
[edit]
Leland McInnes at the English-language Wikipedia, the copyright holder of this work, hereby publishes it under the following license:
| This file is licensed under the Creative Commons Attribution-Share Alike 3.0 Unported license. Subject to disclaimers. | ||
| Attribution: Leland McInnes at the English-language Wikipedia | ||
| ||
| This licensing tag was added to this file as part of the GFDL licensing update. |

|
Permission is granted to copy, distribute and/or modify this document under the terms of the GNU Free Documentation License, Version 1.2 or any later version published by the Free Software Foundation; with no Invariant Sections, no Front-Cover Texts, and no Back-Cover Texts. A copy of the license is included in the section entitled GNU Free Documentation License. Subject to disclaimers. |
Original upload log
[edit]
The original description page was here. All following user names refer to en.wikipedia.
| Date/Time | Dimensions | User | Comment |
|---|---|---|---|
| 2009-01-11 20:50 | 720×540× (230122 bytes) | Leland McInnes | |
| 2007-01-14 00:29 | 1052×744× (40671 bytes) | Leland McInnes | (reverse direction of time scale) |
| 2006-11-04 17:22 | 1052×744× (40730 bytes) | Leland McInnes | |
| 2006-11-04 04:07 | 1052×744× (42937 bytes) | Leland McInnes | |
| 2006-11-04 04:03 | 1052×744× (42931 bytes) | Leland McInnes | One last try at entering the title |
| 2006-11-04 03:56 | 1052×744× (39678 bytes) | Leland McInnes | |
| 2006-11-04 01:04 | 1052×744× (40314 bytes) | Leland McInnes | |
| 2006-11-04 01:02 | 1052×744× (40272 bytes) | Leland McInnes | This figure shows apparent correlations between historical CO2 and temperature records based on Antarctic ice cores, providing data for the last 650,000 years. Note that deuterium levels differ between Vostok and EPICA ice cores and are therefore plotted |
This W3C-unspecified plot was created with Matplotlib.
File history
Click on a date/time to view the file as it appeared at that time.
| Date/Time | Thumbnail | Dimensions | User | Comment | |
|---|---|---|---|---|---|
| current | 05:21, 6 September 2015 | | 720 × 540 (225 KB) | OgreBot (talk | contribs) | (BOT): Reverting to most recent version before archival |
| 05:21, 6 September 2015 |  | 1,052 × 744 (40 KB) | OgreBot (talk | contribs) | (BOT): Uploading old version of file from en.wikipedia; originally uploaded on 2007-01-14 00:29:34 by Leland McInnes | |
| 05:21, 6 September 2015 |  | 1,052 × 744 (40 KB) | OgreBot (talk | contribs) | (BOT): Uploading old version of file from en.wikipedia; originally uploaded on 2006-11-04 17:22:45 by Leland McInnes | |
| 05:21, 6 September 2015 |  | 1,052 × 744 (42 KB) | OgreBot (talk | contribs) | (BOT): Uploading old version of file from en.wikipedia; originally uploaded on 2006-11-04 04:07:29 by Leland McInnes | |
| 05:21, 6 September 2015 |  | 1,052 × 744 (42 KB) | OgreBot (talk | contribs) | (BOT): Uploading old version of file from en.wikipedia; originally uploaded on 2006-11-04 04:03:23 by Leland McInnes | |
| 05:21, 6 September 2015 |  | 1,052 × 744 (39 KB) | OgreBot (talk | contribs) | (BOT): Uploading old version of file from en.wikipedia; originally uploaded on 2006-11-04 03:56:48 by Leland McInnes | |
| 05:21, 6 September 2015 |  | 1,052 × 744 (39 KB) | OgreBot (talk | contribs) | (BOT): Uploading old version of file from en.wikipedia; originally uploaded on 2006-11-04 01:04:39 by Leland McInnes | |
| 05:21, 6 September 2015 |  | 1,052 × 744 (39 KB) | OgreBot (talk | contribs) | (BOT): Uploading old version of file from en.wikipedia; originally uploaded on 2006-11-04 01:02:05 by Leland McInnes | |
| 01:24, 5 September 2015 |  | 720 × 540 (225 KB) | Hiperfelix (talk | contribs) | Transferred from en.wikipedia |
You cannot overwrite this file.
File usage on Commons
There are no pages that use this file.
File usage on other wikis
The following other wikis use this file:
- Usage on de.wikipedia.org
- Usage on en.wikipedia.org
- Usage on es.wikipedia.org
- Usage on fa.wikipedia.org
- Usage on it.wikibooks.org