File:Exponential pdf.svg
Jump to navigation
Jump to search

Size of this PNG preview of this SVG file: 360 × 288 pixels. Other resolutions: 300 × 240 pixels | 600 × 480 pixels | 960 × 768 pixels | 1,280 × 1,024 pixels | 2,560 × 2,048 pixels.
Original file (SVG file, nominally 360 × 288 pixels, file size: 32 KB)
Captions
Captions
Add a one-line explanation of what this file represents
Summary
[edit]| Description |
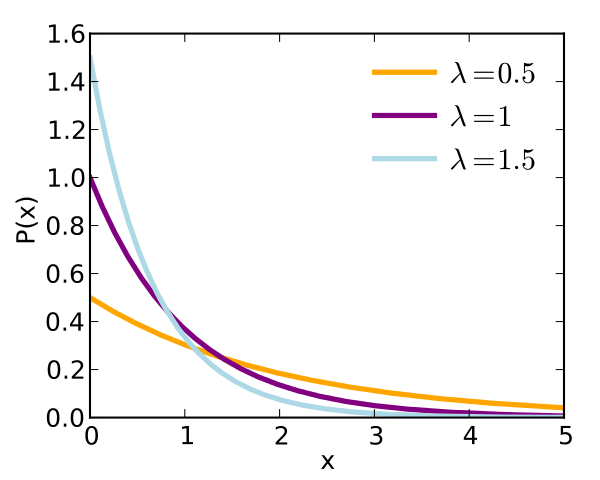
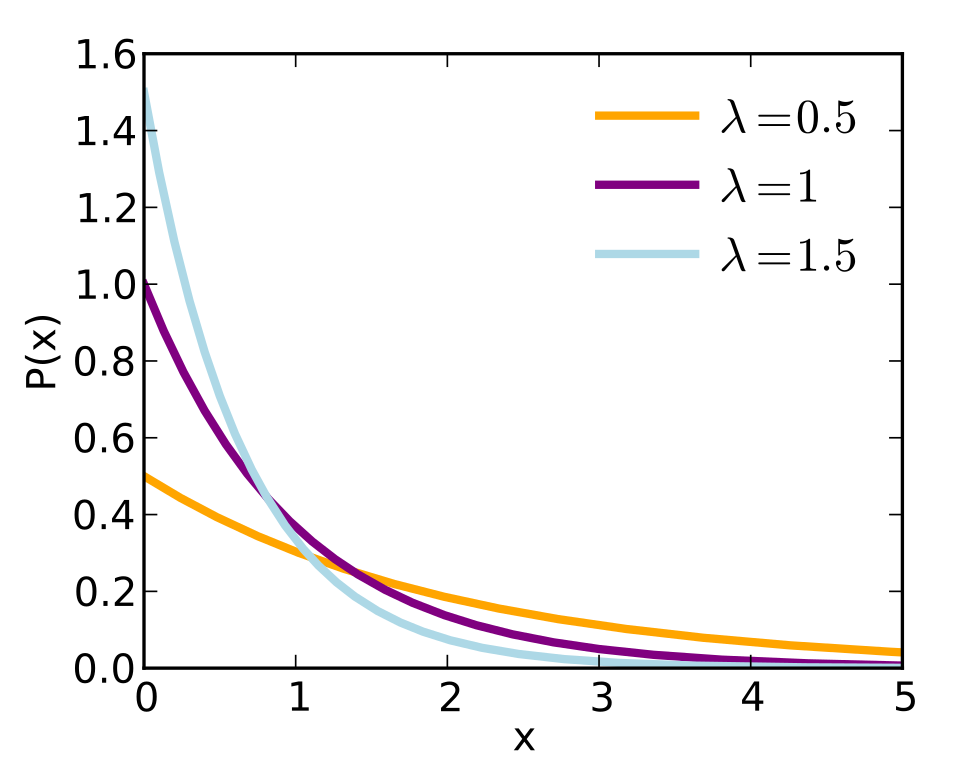
English: Plot of the density function of several exponential distributions. |
| Date | |
| Source | Own work |
| Author | Skbkekas |
| Other versions |
|
| SVG development | This plot was created with Matplotlib. |
| Source code | Python codeimport numpy as np
import matplotlib.pyplot as plt
col = {0.5: 'orange', 1: 'purple', 1.5: 'lightblue'}
X = np.arange(0, 5, 0.01)
##
## PDF
##
plt.clf()
plt.figure(figsize=(4,3.2))
plt.axes([0.15,0.13,0.79,0.8])
plt.hold(True)
A = []
for L in 0.5,1,1.5:
P = L*np.exp(-L*X)
a = plt.plot(X, P, '-', color=col[L], lw=2.5)
A.append(a)
plt.xlabel("x")
plt.ylabel("P(x)")
bx = plt.legend(A, (r"$\lambda=0.5$", r"$\lambda=1$", r"$\lambda=1.5$"),\
numpoints=1, handletextpad=0.5, loc="upper right")
bx.draw_frame(False)
plt.xlim(0,5)
plt.savefig("exponential_pdf.pdf")
plt.savefig("exponential_pdf.svg")
##
## CDF
##
plt.clf()
plt.figure(figsize=(4,3.2))
plt.axes([0.15,0.13,0.79,0.8])
plt.hold(True)
A = []
for L in 0.5,1,1.5:
P = 1- np.exp(-L*X)
a = plt.plot(X, P, '-', color=col[L], lw=2.5)
A.append(a)
plt.xlabel("x")
plt.ylabel(u"P(X\N{Less-THAN OR EQUAL TO}x)")
bx = plt.legend(A, (r"$\lambda=0.5$", r"$\lambda=1$", r"$\lambda=1.5$"),\
numpoints=1, handletextpad=0.5, loc="lower right")
bx.draw_frame(False)
plt.xlim(0,5)
plt.savefig("exponential_cdf.pdf")
plt.savefig("exponential_cdf.svg")
|


Licensing
[edit]
I, the copyright holder of this work, hereby publish it under the following license:
This file is licensed under the Creative Commons Attribution 3.0 Unported license.
- You are free:
- to share – to copy, distribute and transmit the work
- to remix – to adapt the work
- Under the following conditions:
- attribution – You must give appropriate credit, provide a link to the license, and indicate if changes were made. You may do so in any reasonable manner, but not in any way that suggests the licensor endorses you or your use.
File history
Click on a date/time to view the file as it appeared at that time.
| Date/Time | Thumbnail | Dimensions | User | Comment | |
|---|---|---|---|---|---|
| current | 17:18, 18 February 2010 | | 360 × 288 (32 KB) | Skbkekas (talk | contribs) | {{Information |Description={{en|1=Plot of the density function of several exponential distributions.}} |Source={{own}} |Author=Skbkekas |Date=2010-02-18 |Permission= |other_versions= }} Category:Statistical diagrams |
You cannot overwrite this file.
File usage on Commons
The following 3 pages use this file:
File usage on other wikis
The following other wikis use this file:
- Usage on ar.wikipedia.org
- Usage on ast.wikipedia.org
- Usage on ca.wikipedia.org
- Usage on cs.wikipedia.org
- Usage on de.wikipedia.org
- Usage on de.wikiversity.org
- Usage on el.wikipedia.org
- Usage on en.wikipedia.org
- Usage on en.wikibooks.org
- Usage on es.wikipedia.org
- Usage on eu.wikipedia.org
- Usage on fa.wikipedia.org
- Usage on fi.wikipedia.org
- Usage on fr.wikipedia.org
- Usage on gl.wikipedia.org
- Usage on hu.wikipedia.org
- Usage on it.wikipedia.org
- Usage on ja.wikipedia.org
- Usage on ko.wikipedia.org
- Usage on sv.wikipedia.org
- Usage on tr.wikipedia.org
- Usage on uk.wikipedia.org
- Usage on zh.wikipedia.org