File:Extreme points illustration.png
From Wikimedia Commons, the free media repository
Jump to navigation
Jump to search
Extreme_points_illustration.png (427 × 396 pixels, file size: 10 KB, MIME type: image/png)
File information
Structured data
Captions
Captions
Add a one-line explanation of what this file represents
Summary
[edit]Transferred from en.wikipedia to Commons by Maksim.
The original description page was here. All following user names refer to en.wikipedia.

|
File:Extreme points.svg is a vector version of this file. It should be used in place of this PNG file when not inferior.
File:Extreme points illustration.png → File:Extreme points.svg
For more information, see Help:SVG.
|
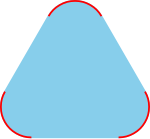
This diagram was created with MATLAB.
Licensing
[edit]| Public domainPublic domainfalsefalse |
| I, the copyright holder of this work, release this work into the public domain. This applies worldwide. In some countries this may not be legally possible; if so: I grant anyone the right to use this work for any purpose, without any conditions, unless such conditions are required by law. |
function main()

   clf; hold on; axis equal; axis off;                     % prepare the screen
   linewidth=3; i=sqrt(-1); N=50; height=0.3; V=[]; M=[];  % initialize variables
   white=0.99*[1, 1, 1]; red=[1, 0, 0]; lightblue=[135 206 250]/256;

   Z=[0, 1, 0.5+i*sqrt(3)/2.0]; L=length(Z);

   [V, M]=corner (N, V, M, Z(L), Z(1), Z(2), height);
   for k=2:(L-1)
      [V, M]=corner (N, V, M, Z(k-1), Z(k), Z(k+1), height);
   end
   [V, M]=corner (N, V, M, Z(L-1), Z(L), Z(1), height);

   H=fill(real(V), imag(V), lightblue); set(H, 'LineWidth', linewidth/2, 'EdgeColor', lightblue)

   for k=1:L
      W=M(k, :);
      plot(W, 'color', red, 'linewidth', linewidth)
   end

   % force the window to be a bit bigger than the picture
   Winxmin=min(real(V));  Winxmax=max(real(V));
   Winymin=min(imag(V));  Winymax=max(imag(V));
   bd=0.1;
   plot(Winxmin-bd, Winymin-bd, 'color', white);
   plot(Winxmax+bd, Winymax+bd, 'color', white);

saveas(gcf, 'Extreme_points_illustration.eps', 'psc2')

% make a rounded corner at b with edges going towards a and c (all complex numbers)
function [V, M]=corner (N, V, M, a, b, c, height)

   i=sqrt(-1);
   v=-i*height*(b-a)/abs(b-a); w=-i*height*(c-b)/abs(c-b);
   theta1=atan2(imag(v), real(v));  theta2=theta1+atan2(imag(w/v), real(w/v));
   Theta=linspace(theta1, theta2, N);
   C=b+height*exp(i*Theta);

   M=[M', C']'; V=[V, C];
| date/time | username | edit summary |
|---|---|---|
| 06:32, 21 November 2005 | en:User:Oleg Alexandrov | (<span class="autocomment"><a href="/wiki/Image:Extreme_points_illustration.png#Source_code_in_MATLAB" title="Image:Extreme points illustration.png">→</a>Source code in <a href="/wiki/MATLAB" title="MATLAB">MATLAB</a></span>) |
| 01:33, 21 November 2005 | en:User:Oleg Alexandrov | (+source code) |
| 01:30, 21 November 2005 | en:User:Oleg Alexandrov |
Original upload log
[edit]Legend: (cur) = this is the current file, (del) = delete this old version, (rev) = revert to this old version.
Click on date to download the file or see the image uploaded on that date.
- (del) (cur) 01:30, 21 November 2005 . . en:User:Oleg Alexandrov Oleg Alexandrov ( en:User talk:Oleg Alexandrov Talk) . . 427x396 (10734 bytes)
File history
Click on a date/time to view the file as it appeared at that time.
| Date/Time | Thumbnail | Dimensions | User | Comment | |
|---|---|---|---|---|---|
| current | 19:50, 18 March 2006 |  | 427 × 396 (10 KB) | Maksim (talk | contribs) | La bildo estas kopiita de wikipedia:en. La originala priskribo estas: == Licensing == {{PD-self}} ==Source code in MATLAB== <pre> <nowiki> function main() clf; hold on; axis equal; axis off; % prepare the screen linewidt |
You cannot overwrite this file.
File usage on Commons
There are no pages that use this file.
File usage on other wikis
The following other wikis use this file:
- Usage on en.wikipedia.org

