File:Global Carbon Emission by Type.png

Global_Carbon_Emission_by_Type.png (555 × 402 pixels, file size: 17 KB, MIME type: image/png)
Captions
Captions
Summary
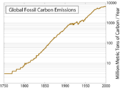
[edit]Global annual fossil fuel carbon dioxide emissions, in million metric tons of carbon, as reported by the Carbon Dioxide Information Analysis Center [1] archive copy at the Wayback Machine.
Original data: Marland, G., T.A. Boden, and R. J. Andres. 2003. "Global, Regional, and National CO2 Emissions." In Trends: A Compendium of Data on Global Change. Carbon Dioxide Information Analysis Center, Oak Ridge National Laboratory, U.S. Department of Energy, Oak Ridge, Tenn., U.S.A. http://cdiac.esd.ornl.gov/trends/emis/tre_glob.htm archive copy at the Wayback Machine]
The data is originally presented in terms of solid (e.g. coal), liquid (e.g. petroleum), gas (i.e. natural gas) fuels, and separate terms for cement production and gas flaring (i.e. natural gas lost during oil and gas mining). In the plotted figure, the gas flaring (the smallest of all categories) was added to the total for natural gas. Note that the carbon dioxide releases from cement production result from the thermal decomposition of limestone into lime, and so technically are not a fossil fuel source.

|
This graph image could be re-created using vector graphics as an SVG file. This has several advantages; see Commons:Media for cleanup for more information. If an SVG form of this image is available, please upload it and afterwards replace this template with
{{vector version available|new image name}}.
It is recommended to name the SVG file “Global Carbon Emission by Type.svg”—then the template Vector version available (or Vva) does not need the new image name parameter. |
Other Versions
[edit]This graph is superceded by a newer version with data thru 2004:Image:Global Carbon Emission by Type to Y2004.png 
Copyright
[edit]The original version of this figure was prepared by Robert A. Rohde from publicly available data, and is incorporated into the Global Warming Art project.

|
Permission is granted to copy, distribute and/or modify this document under the terms of the GNU Free Documentation License, Version 1.2 or any later version published by the Free Software Foundation; with no Invariant Sections, no Front-Cover Texts, and no Back-Cover Texts. A copy of the license is included in the section entitled GNU Free Documentation License. |
| This file is licensed under the Creative Commons Attribution-Share Alike 3.0 Unported license. | ||
| ||
| This licensing tag was added to this file as part of the GFDL licensing update. |
Related figures
[edit]-
 Total global carbon emissions, logarithmic scale.
 -
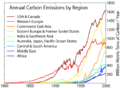 Carbon dioxide emissions by region, linear scale.
 -
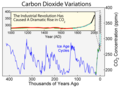 Carbon dioxide concentrations during the last 400 thousand years.
 -
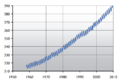 Recent carbon dioxide concentrations measured at Mauna Loa.


Other language
[edit]
File history
Click on a date/time to view the file as it appeared at that time.
| Date/Time | Thumbnail | Dimensions | User | Comment | |
|---|---|---|---|---|---|
| current | 23:02, 28 November 2005 | | 555 × 402 (17 KB) | Tristes tigres~commonswiki (talk | contribs) |
You cannot overwrite this file.
File usage on Commons
The following 3 pages use this file:
File usage on other wikis
The following other wikis use this file:
- Usage on ast.wikipedia.org
- Usage on de.wikipedia.org
- Usage on en.wikipedia.org
- Usage on en.wikinews.org
- Usage on es.wikipedia.org
- Usage on et.wikipedia.org
- Usage on no.wikipedia.org