File:Heinrich-events.png
Jump to navigation
Jump to search

Size of this preview: 800 × 560 pixels. Other resolutions: 320 × 224 pixels | 640 × 448 pixels | 1,024 × 717 pixels | 1,250 × 875 pixels.
Original file (1,250 × 875 pixels, file size: 170 KB, MIME type: image/png)
Captions
Captions
Add a one-line explanation of what this file represents
Summary
[edit]
| Description |
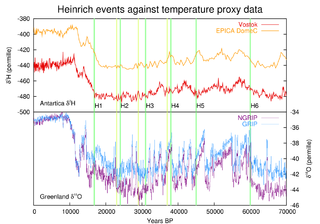
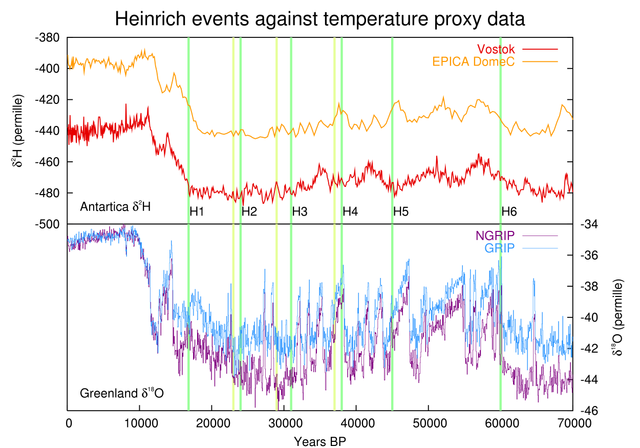
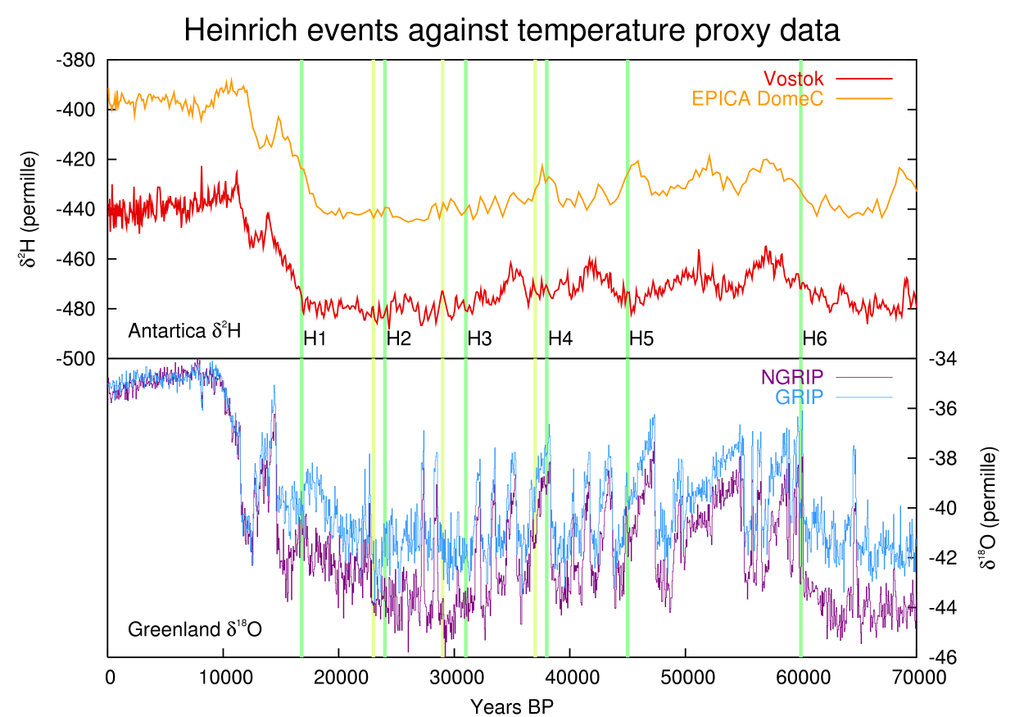
English: en:Heinrich events, denoted by vertical green bars, plotted against temperature proxy data from Antarctic and Greenland ice cores. en:Dansgaard-Oeschger events can be seen most clearly in the Greenland delta 18O data. Darker green bars represent the Heinrich events from Hemming 2004, while the lighter green represents alternative dates for events 2 through 4 from Bond [1]. |
| Date | 5 February 2006 (original upload date) |
| Source |
Transferred from en.wikipedia to Commons by Pinpin.
|
| Author | Leland McInnes at English Wikipedia |

|
This diagram image could be re-created using vector graphics as an SVG file. This has several advantages; see Commons:Media for cleanup for more information. If an SVG form of this image is available, please upload it and afterwards replace this template with
{{vector version available|new image name}}.
It is recommended to name the SVG file “Heinrich-events.svg”—then the template Vector version available (or Vva) does not need the new image name parameter. |
Copyright
[edit]
This figure was produced by Leland McInnes using gnuplot and is licensed under the en:GFDL. All data is from publicly available sources.
Licensing
[edit]
Leland McInnes at the English-language Wikipedia, the copyright holder of this work, hereby publishes it under the following license:
| This file is licensed under the Creative Commons Attribution-Share Alike 3.0 Unported license. Subject to disclaimers. | ||
| Attribution: Leland McInnes at the English-language Wikipedia | ||
| ||
| This licensing tag was added to this file as part of the GFDL licensing update. |

|
Permission is granted to copy, distribute and/or modify this document under the terms of the GNU Free Documentation License, Version 1.2 or any later version published by the Free Software Foundation; with no Invariant Sections, no Front-Cover Texts, and no Back-Cover Texts. A copy of the license is included in the section entitled GNU Free Documentation License. Subject to disclaimers. |
Original upload log
[edit]
The original description page was here. All following user names refer to en.wikipedia.
- 2006-02-05 22:41 Leland McInnes 1250×875×8 (173778 bytes) [[Heinrich event]]s, denoted by vertical green bars, plotted against temperature proxy data from Antarctic and Greenland ice cores. [[Dansgaard-Oeschger event]]s can be seen most clearly in the Greenland delta <sup>18</sup>O data. Darker green bars repres
File history
Click on a date/time to view the file as it appeared at that time.
| Date/Time | Thumbnail | Dimensions | User | Comment | |
|---|---|---|---|---|---|
| current | 08:18, 12 March 2008 | | 1,250 × 875 (170 KB) | File Upload Bot (Magnus Manske) (talk | contribs) | {{BotMoveToCommons|en.wikipedia}} {{Information |Description={{en|__NOTOC__ == Description == en:Heinrich events, denoted by vertical green bars, plotted against temperature proxy data from Antarctic and Greenland ice cores. [[:en:Dansgaard-Oeschge |
You cannot overwrite this file.
File usage on Commons
The following page uses this file:
File usage on other wikis
The following other wikis use this file:
- Usage on de.wikipedia.org
- Usage on en.wikipedia.org
- Usage on es.wikipedia.org
- Usage on fi.wikipedia.org
- Usage on nl.wikipedia.org