File:High plains fresh groundwater usage 2000.svg

Original file (SVG file, nominally 747 × 946 pixels, file size: 1.48 MB)
Captions
Captions
Summary
[edit]
| Description |
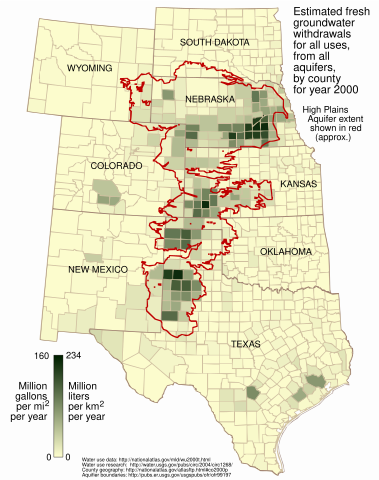
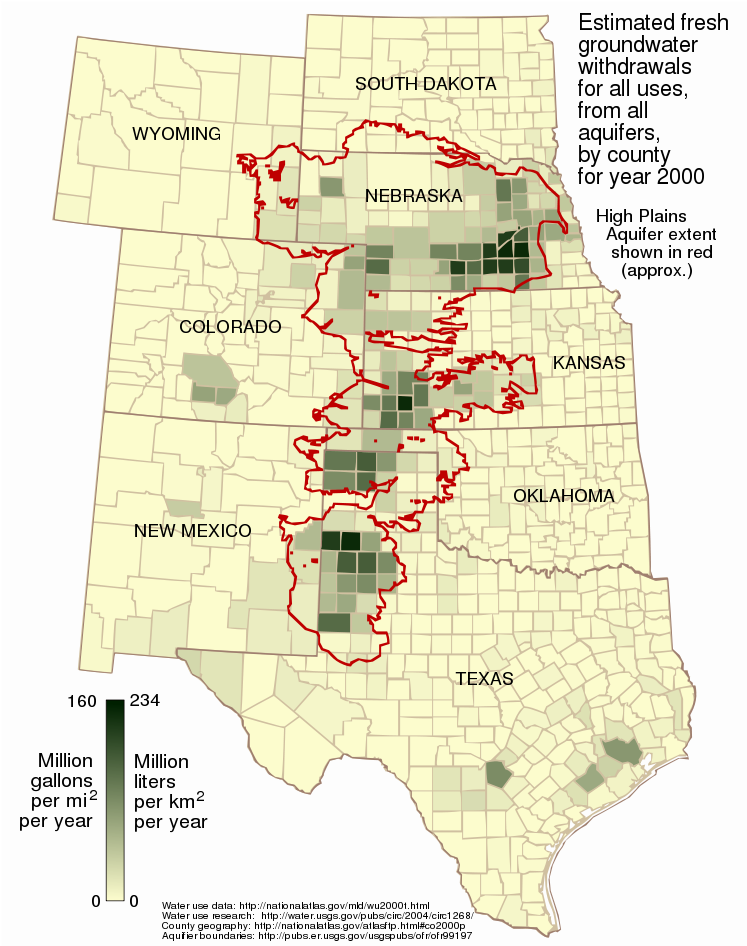
English: This map shows the estimated fresh water usage per square mile in the year 2000 for counties in the eight states underlain in part by the High Plains (Ogallala) Aquifer, presented as million gallons per square mile and million liters per square kilometer.
Usage is for all purposes -- public supply, industrial, irrigation, mining, livestock, and thermoelectric power -- from all underground sources, not just from the Ogallala Aquifer. Water usage data for the year 2000 was taken from the datafile wu2000t.dbf[1] from the US National Atlas[2]. Citation information from the metadata for that file:
Additionally:
The attribute used in this map is described:
The data is supplied as million gallons per day, by county. To arrive at an annual amount per square mile per year, the usage value from wu2000t.dbf was multiplied by 365 and divided by the number of square miles in the county as given in the 2000 county shapefile co2000p020 from the National Atlas:
Aquifer boundaries taken from Fischer and McGuire[3]. The map is presented in a Lambert azimuthal equal-area projection as used in the National Atlas (EPSG:2163[4]), the central meridian and latitude of which align nicely with the aquifer. |
| Date | |
| Source | Own work |
| Author | Kbh3rd |
| Other versions | File:Ogallala area freshwater ground withdrawals all aquifers.png |
Licensing
[edit]
- You are free:
- to share – to copy, distribute and transmit the work
- to remix – to adapt the work
- Under the following conditions:
- attribution – You must give appropriate credit, provide a link to the license, and indicate if changes were made. You may do so in any reasonable manner, but not in any way that suggests the licensor endorses you or your use.
- share alike – If you remix, transform, or build upon the material, you must distribute your contributions under the same or compatible license as the original.
File history
Click on a date/time to view the file as it appeared at that time.
| Date/Time | Thumbnail | Dimensions | User | Comment | |
|---|---|---|---|---|---|
| current | 23:13, 9 March 2009 | | 747 × 946 (1.48 MB) | Kbh3rd (talk | contribs) | corrected metric conversion - see talk |
| 01:28, 3 March 2009 |  | 747 × 946 (1.48 MB) | Kbh3rd (talk | contribs) | The map said "acre" while the data, as noted on the image description page, correctly said "square mile". I have fixed that and made some minor esthetic adjustments of the state name locations. | |
| 23:40, 2 March 2009 |  | 747 × 946 (1.48 MB) | Kbh3rd (talk | contribs) | {{Information |Description={{en|1=This map shows the estimated fresh water usage per square mile in the year 2000 for counties in the eight states underlain in part by the High Plains (Ogallala) Aquifer, presented as million milli |
You cannot overwrite this file.
File usage on Commons
There are no pages that use this file.
File usage on other wikis
The following other wikis use this file:
- Usage on ar.wikipedia.org
- Usage on ca.wikipedia.org
- Usage on ckb.wikipedia.org
- Usage on en.wikipedia.org
- Usage on fy.wikipedia.org
- Usage on kk.wikipedia.org
- Usage on kw.wikipedia.org
- Usage on ml.wikipedia.org
- Usage on pt.wikipedia.org
- Usage on sr.wikipedia.org
- Usage on vi.wikipedia.org
- Usage on www.wikidata.org
- Usage on zh.wikipedia.org