File:Kamenz Population Statistics.svg
Jump to navigation
Jump to search

Size of this PNG preview of this SVG file: 600 × 480 pixels. Other resolutions: 300 × 240 pixels | 960 × 768 pixels | 1,280 × 1,024 pixels | 2,560 × 2,048 pixels.
Original file (SVG file, nominally 600 × 480 pixels, file size: 25 KB)
Captions
Captions
Add a one-line explanation of what this file represents
Summary
[edit]
| Description |
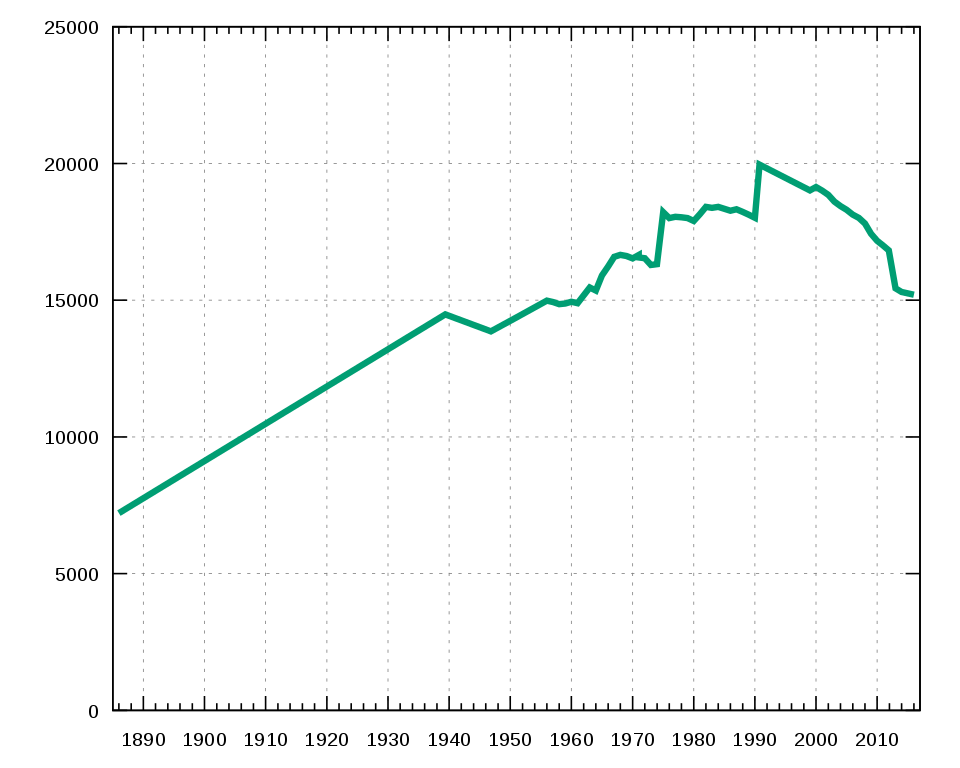
Deutsch: Diagramm zeigt die Einwohnerentwicklung der deutschen Stadt Kamenz. English: Diagram shows population statistics of the german city Kamenz. |
| Date | 03.12.2005 |
| Source |
Deutsch: Diagramm von mir erstellt mit Gnuplot, für Skripte und Daten s.u. English: Diagram drawn by myself with Gnuplot, see script and data below |
| Author | Dabbelju |
| Permission (Reusing this file) |
GFDL |
W3C-validity not checked.
Source Files
[edit]
English: To update the diagram, save the dat and plt file in separate text-files and modify the data in the way you want. Then call "gnuplot Kamenz_Population_Statistics.plt" (under Windows you can start the GUI with wgnuplot and then open the file) and a new SVG file has been created.
Deutsch: Um ein Diagramm zu aktualisieren, speichere die dat- und plt-Datei in Text-Dateien und modifiziere die Daten entsprechend. Dann rufe "gnuplot Kamenz_Population_Statistics.plt" auf (unter Windows kann auch wgnuplot gestartet und dann diese Datei über die grafische Oberfläche geöffnet werden) und eine neue SVG
Datei wurde generiert.
Data File "Kamenz_Population_Statistics.dat"
[edit]
# Kamenz - Population Statistics
# -----------------------------------------
# bis 1981 Volkszählungsergebnisse
# Quellen für die Zahlen ...
# 1885: Meyers Konversations-Lexikon
# 1939: Statistisches Jahrbuch für das Deutsche Reich 1941/42
# 1945 - 1989, Statistisches Jahrbuch der DDR
# ab 1990, Statistisches Landesamt des Freistaates Sachsen

1885-12-31 7211
1939-05-17 14483 # (13202 ständige)
1946-10-29 13862
1950-08-31 14331
1955-12-31 14981
1956-12-31 14931
1957-12-31 14857
1958-12-31 14876
1959-12-31 14944
1960-12-31 14888
1962-12-31 15461
1963-12-31 15350
1964-12-31 15905
1965-12-31 16236
1966-12-31 16585
1967-12-31 16657
1968-12-31 16618
1969-12-31 16528
1970-12-31 16653
1971-01-01 16565
1971-12-31 16532
1972-12-31 16289
1973-12-31 16315
1974-12-31 18221
1975-12-31 18001
1976-12-31 18052
1977-12-31 18030
1978-12-31 18001
1979-12-31 17898
1980-12-31 18143
1981-12-31 18410
1982-12-31 18377
1983-12-31 18410
1984-12-31 18339
1985-12-31 18269
1986-12-31 18323
1987-12-31 18229
1988-12-31 18126
1989-12-31 18016
1990-10-03 19954
1998-12-31 19013
1999-12-31 19136
2000-12-31 19010
2001-12-31 18848
2002-12-31 18606
2003-12-31 18440
2004-12-31 18308
2005-12-31 18129
2006-12-31 18009
2007-12-31 17802
2008-12-31 17431
2009-12-31 17171
2010-12-31 16990
2011-11-30 16819
2012-12-31 15432
2013-12-31 15301
2015-12-31 15202 # https://www.statistik.sachsen.de/download/010_GB-Bev/Bev_Z_Gemeinde_akt.pdf
Gnuplot Script "Kamenz_Population_Statistics.plt"
[edit]
# Specifies encoding and output format
set encoding iso_8859_1
set terminal svg
set output 'Kamenz_Population_Statistics.svg'

# How to read the data with the years
set xdata time
set timefmt "%Y-%m-%d"

# Specifies the range of the axes and appearance
set xrange ["1885-01-01":"2017-01-01"]
set xtics '1000-01-01', 60 * 60 * 24 * 365.25 * 10
set mxtics 5
set yrange [0:25000]
set format x "%Y"
set grid
set key left

# Draws the plot and specifies its appearance ...
plot 'Kamenz_Population_Statistics.dat' using 1:2 notitle with lines lt 2 lw 4
Licensing
[edit]
I, the copyright holder of this work, hereby publish it under the following licenses:

|
Permission is granted to copy, distribute and/or modify this document under the terms of the GNU Free Documentation License, Version 1.2 or any later version published by the Free Software Foundation; with no Invariant Sections, no Front-Cover Texts, and no Back-Cover Texts. A copy of the license is included in the section entitled GNU Free Documentation License. |
| This file is licensed under the Creative Commons Attribution-Share Alike 3.0 Unported license. | ||
| ||
| This licensing tag was added to this file as part of the GFDL licensing update. |
You may select the license of your choice.
File history
Click on a date/time to view the file as it appeared at that time.
| Date/Time | Thumbnail | Dimensions | User | Comment | |
|---|---|---|---|---|---|
| current | 21:10, 29 October 2017 | | 600 × 480 (25 KB) | Summer ... hier! (talk | contribs) | Unterteilung der X-Achse mit runden Werten |
| 20:31, 29 October 2017 |  | 600 × 480 (22 KB) | Dabbelju (talk | contribs) | Update | |
| 16:36, 19 November 2011 |  | 600 × 480 (13 KB) | Dabbelju (talk | contribs) | Update 2005-2010 | |
| 01:17, 4 December 2005 |  | 600 × 480 (9 KB) | Dabbelju (talk | contribs) | == Description == * {{english}} {{Information| |Description = Diagram shows population statistics of the german city en:Kamenz. |Source = Diagram drawn by myself with Gnuplot, see script and data below |Date = 3. December 2005 |Author |
You cannot overwrite this file.
File usage on Commons
The following page uses this file:
File usage on other wikis
The following other wikis use this file:
- Usage on azb.wikipedia.org
- Usage on cs.wikipedia.org
- Usage on de.wikipedia.org
- Usage on pl.wikipedia.org