File:Mauna Loa Carbon Dioxide-pt.svg
Jump to navigation
Jump to search

Size of this PNG preview of this SVG file: 800 × 515 pixels. Other resolutions: 320 × 206 pixels | 640 × 412 pixels | 1,024 × 659 pixels | 1,280 × 824 pixels | 2,560 × 1,647 pixels | 850 × 547 pixels.
Original file (SVG file, nominally 850 × 547 pixels, file size: 31 KB)
Captions
Captions
Add a one-line explanation of what this file represents
| Description |
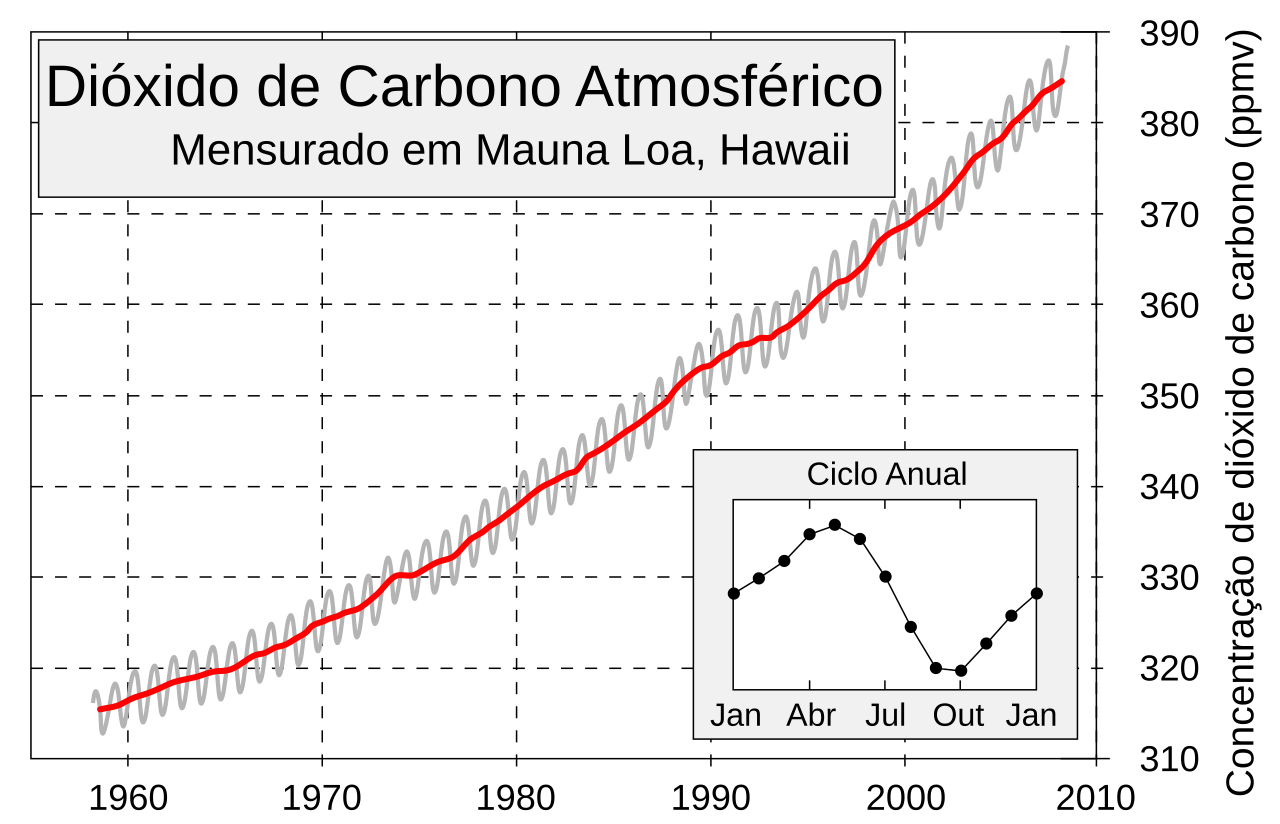
English: This figure shows the history of atmospheric carbon dioxide concentrations as directly measured at Mauna Loa, Hawaii. This curve is known as the Keeling curve, and is an essential piece of evidence of the man-made increases in greenhouse gases that are believed to be the cause of global warming. The longest such record exists at Mauna Loa, but these measurements have been independently confirmed at many other sites around the world [1].
The annual fluctuation in carbon dioxide is caused by seasonal variations in carbon dioxide uptake by land plants. Since many more forests are concentrated in the Northern Hemisphere, more carbon dioxide is removed from the atmosphere during Northern Hemisphere summer than Southern Hemisphere summer. This annual cycle is shown in the inset figure by taking the average concentration for each month across all measured years. The grey curve shows the average monthly concentrations, and red curve is a moving 12 month average. |
||
| Date | |||
| Source | Own work, from Image:Mauna Loa Carbon Dioxide.png, uploaded in Commons by Nils Simon under licence GFDL & CC-NC-SA ; itself created by Robert A. Rohde from NOAA published data and is incorporated into the Global Warming Art project. | ||
| Author | Sémhur (Translated to portuguese by Pedro Spoladore) | ||
| Permission (Reusing this file) |
I, the copyright holder of this work, hereby publish it under the following licenses:
This file is licensed under the Creative Commons Attribution-Share Alike 3.0 Unported, 2.5 Generic, 2.0 Generic and 1.0 Generic license.
You may select the license of your choice. |
||
| Other versions |
[]
| ||
| SVG | W3C-validity not checked.
|


| Camera location | | View this and other nearby images on: OpenStreetMap |
|---|
File history
Click on a date/time to view the file as it appeared at that time.
| Date/Time | Thumbnail | Dimensions | User | Comment | |
|---|---|---|---|---|---|
| current | 10:07, 27 June 2008 | | 850 × 547 (31 KB) | Sémhur (talk | contribs) | Data updated (now from 1958 to june 2008) |
| 00:25, 29 May 2008 |  | 826 × 547 (34 KB) | Spoladore (talk | contribs) | {{Information |Description={{en|1=This figure shows the history of atmospheric carbon dioxide concentrations as directly measured at Mauna Loa, Hawaii. This curve is known as the |
You cannot overwrite this file.
File usage on Commons
There are no pages that use this file.
File usage on other wikis
The following other wikis use this file:
- Usage on pt.wikipedia.org