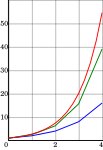
File:Numerical integration illustration, h=1.png
From Wikimedia Commons, the free media repository
Jump to navigation
Jump to search

Size of this preview: 412 × 600 pixels. Other resolutions: 165 × 240 pixels | 330 × 480 pixels | 528 × 768 pixels | 703 × 1,024 pixels | 1,500 × 2,183 pixels.
Original file (1,500 × 2,183 pixels, file size: 72 KB, MIME type: image/png)
File information
Structured data
Captions
Captions
Add a one-line explanation of what this file represents

|
File:Numerical integration illustration, step=1.svg is a vector version of this file. It should be used in place of this PNG file when not inferior.
File:Numerical integration illustration, h=1.png → File:Numerical integration illustration, step=1.svg
For more information, see Help:SVG.
|
Summary
[edit]| DescriptionNumerical integration illustration, h=1.png | Illustration of Numerical ordinary differential equations |
| Source | Own work |
| Author | Oleg Alexandrov |
This diagram was created with MATLAB.
| Public domainPublic domainfalsefalse |
| I, the copyright holder of this work, release this work into the public domain. This applies worldwide. In some countries this may not be legally possible; if so: I grant anyone the right to use this work for any purpose, without any conditions, unless such conditions are required by law. |
% illustration of numerical integration
% compare the Forward Euler method, which is globally O(h)
% with Midpoint method, which is globally O(h^2)
% and the exact solution

function main()

   f = inline ('y', 't', 'y'); % will solve y' = f(t, y)

   a=0; b=4; % endpoints of the interval where we will solve the ODE
   N = 5; T = linspace(a, b, N); h = T(2)-T(1); % the grid
   y0 = 1; % initial condition

   % solve the ODE
   Y_euler = solve_ODE (N, f, y0,  h, T, 1); % Forward Euler method
   Y_midpt = solve_ODE (N, f, y0,  h, T, 2); % midpoint method
   T_highres = a:0.1:b; Y_exact = exp(T_highres);

%  prepare the plotting window
   lw = 3; % curves linewidth
   fs = 20; % font size
   figure(1); clf; set(gca, 'fontsize', fs);   hold on;

   % colors
   red=[0.867 0.06 0.14];
   blue = [0, 129, 205]/256;
   green = [0, 200,  70]/256;

% plot the solutions
   plot(T, Y_euler, 'color', blue,  'linewidth', lw)
   plot(T, Y_midpt, 'color', green, 'linewidth', lw)
   plot(T_highres, Y_exact, 'color', red,   'linewidth', lw)

   % axes aspect ratio
   pbaspect([1 1.5 1]);

% save to disk
   disp(sprintf('Grid size is %0.9g', h))
   saveas(gcf, sprintf('Numerical_integration_illustration,_h=%0.2g.eps', h), 'psc2');

function Y = solve_ODE (N, f, y0,  h, T, method)

   Y = 0*T;

   Y(1)=y0;
   for i=1:(N-1)
	  t = T(i); y = Y(i);

	  if method == 1 % forward Euler method

		 Y(i+1) = y + h*f(t, y);

	  elseif method == 2 % explicit one step midpoint method

		 K = y + 0.5*h*f(t, y);
		 Y(i+1) =  y + h*f(t+h/2, K);

	  else
		 disp ('Don`t know this type of method');
		 return;

	  end
   end
File history
Click on a date/time to view the file as it appeared at that time.
| Date/Time | Thumbnail | Dimensions | User | Comment | |
|---|---|---|---|---|---|
| current | 02:57, 25 May 2007 |  | 1,500 × 2,183 (72 KB) | Oleg Alexandrov (talk | contribs) | Make exact curve smooth |
| 04:59, 20 May 2007 |  | 1,500 × 2,183 (72 KB) | Oleg Alexandrov (talk | contribs) | Higher resolution. Same license. | |
| 03:09, 20 May 2007 |  | 375 × 546 (15 KB) | Oleg Alexandrov (talk | contribs) | {{Information |Description=Illustration of Numerical ordinary differential equations |Source=self-made |Date= |Author= User:Oleg Alexandrov }} Category:Numerical analysis {{PD-self}} |
You cannot overwrite this file.
File usage on Commons
There are no pages that use this file.
File usage on other wikis
The following other wikis use this file:
- Usage on ca.wikipedia.org
- Usage on el.wikipedia.org
- Usage on it.wikipedia.org
- Usage on mn.wikipedia.org
- Usage on pt.wikipedia.org
- Usage on tl.wikipedia.org
- Usage on uk.wikipedia.org
- Usage on zh.wikipedia.org
