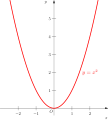
File:Parabola2.svg
From Wikimedia Commons, the free media repository
Jump to navigation
Jump to search

Size of this PNG preview of this SVG file: 375 × 415 pixels. Other resolutions: 217 × 240 pixels | 434 × 480 pixels | 694 × 768 pixels | 925 × 1,024 pixels | 1,851 × 2,048 pixels.
Original file (SVG file, nominally 375 × 415 pixels, file size: 23 KB)
File information
Structured data
Captions
Captions
Add a one-line explanation of what this file represents
Summary
[edit]| DescriptionParabola2.svg |
Deutsch: Verlauf der Parabel  auf auf  |
| Date | |
| Source | Own work |
| Author | Lennart Kudling |
| SVG development InfoField | This vector image was created with Asymptote. |
| Source code InfoField | Asymptote codeimport graph;
import settings;
outformat="pdf";
size(300,600);
// Function.
real f(real x) {return x ** 3; }
draw(graph(f,-2.45,2.45),red+2);
label(scale(1.3)*"$y=x^2$",(1.6,5),red);
// Axes.
xaxis( Label("$x$"), Ticks(new real[]{-2,-1,1,2}), Arrow, xmin=-3, xmax=3);
yaxis( Label("$y$"), Ticks(new real[]{1,2,3,4,5}), Arrow, ymin=-0.4, ymax=6);
// Origin.
labelx("$O$",0,SW);
|
Licensing
[edit]| Public domainPublic domainfalsefalse |
| This work has been released into the public domain by its author, User:LennyWikidata at German Wikipedia. This applies worldwide. In some countries this may not be legally possible; if so: User:LennyWikidata grants anyone the right to use this work for any purpose, without any conditions, unless such conditions are required by law.Public domainPublic domainfalsefalse |
Original upload log
[edit]The original description page was here. All following user names refer to de.wikipedia.
- 2008-02-03 18:55 Lenny222 375×398 (28054 bytes) {{Information |Beschreibung = |Quelle = |Urheber = |Datum = |Genehmigung = |Andere Versionen = |Anmerkungen = }}
File history
Click on a date/time to view the file as it appeared at that time.
| Date/Time | Thumbnail | Dimensions | User | Comment | |
|---|---|---|---|---|---|
| current | 14:36, 26 October 2009 |  | 375 × 415 (23 KB) | LennyWikipedia~commonswiki (talk | contribs) | move label up |
| 13:34, 26 October 2009 |  | 375 × 415 (23 KB) | LennyWikipedia~commonswiki (talk | contribs) | {de|Parabola}<br/> Asymptote source code: import graph; import settings; outformat="pdf"; // size(300,600); // // Function. real f(real x) {return x ** 2; } draw(graph(f,-2.45,2.45),red+2); label(scale(1.3)*"$y=x^2$",(2,2),red); // // Axes. xaxis( La | |
| 20:31, 4 May 2008 |  | 375 × 398 (27 KB) | File Upload Bot (Magnus Manske) (talk | contribs) | {{BotMoveToCommons|de.wikipedia}} {{Information |Description={{de|Parabola<br/> Asymptote source code: <pre> import graph; import settings; outformat="pdf"; size(300,600); real f(real x) {return x ** 2; } draw(graph(f,-2.45,2.45),red+2); label(scale(1.3) |
You cannot overwrite this file.
File usage on Commons
The following 2 pages use this file:
File usage on other wikis
The following other wikis use this file:
- Usage on ar.wikipedia.org
- Usage on bar.wikipedia.org
- Usage on de.wikipedia.org
- Usage on de.wikibooks.org
- Mathe für Nicht-Freaks: Abbildung, Funktion
- Mathe für Nicht-Freaks: Wurzel
- Mathe für Nicht-Freaks: Folgenkriterium der Stetigkeit: Folgenstetigkeit
- Benutzer:Dirk Hünniger/mnf
- Mathe für Nicht-Freaks: Stetigkeit von Funktionen
- Mathe für Nicht-Freaks: Ableitung und Differenzierbarkeit
- Mathe für Nicht-Freaks: Stetigkeit beweisen: Epsilon-Delta-Kriterium und Folgenkriterium
- Benutzer:Dirk Hünniger/mnfana
- Benutzer:Benjamin Wolba/ Spielwiese
- Serlo: EN: Continuity of functions
- Serlo: EN: Derivatives
- Usage on en.wikipedia.org
- Usage on et.wikipedia.org
- Usage on fi.wikipedia.org
- Usage on frr.wikipedia.org
- Usage on he.wikibooks.org
- Usage on hy.wikipedia.org
- Usage on id.wikipedia.org
- Usage on ja.wikipedia.org
- Usage on ko.wikipedia.org
- Usage on ms.wikipedia.org
- Usage on ru.wikipedia.org
- Usage on sr.wikipedia.org
- Usage on ta.wikipedia.org
- Usage on th.wikipedia.org
- Usage on tl.wikipedia.org
- Usage on vi.wikipedia.org
Hidden categories: