File:Poissonprozess.png
Jump to navigation
Jump to search

Size of this preview: 800 × 600 pixels. Other resolutions: 320 × 240 pixels | 640 × 480 pixels | 1,024 × 768 pixels | 1,280 × 960 pixels | 1,600 × 1,200 pixels.
Original file (1,600 × 1,200 pixels, file size: 9 KB, MIME type: image/png)
Captions
Captions
Add a one-line explanation of what this file represents
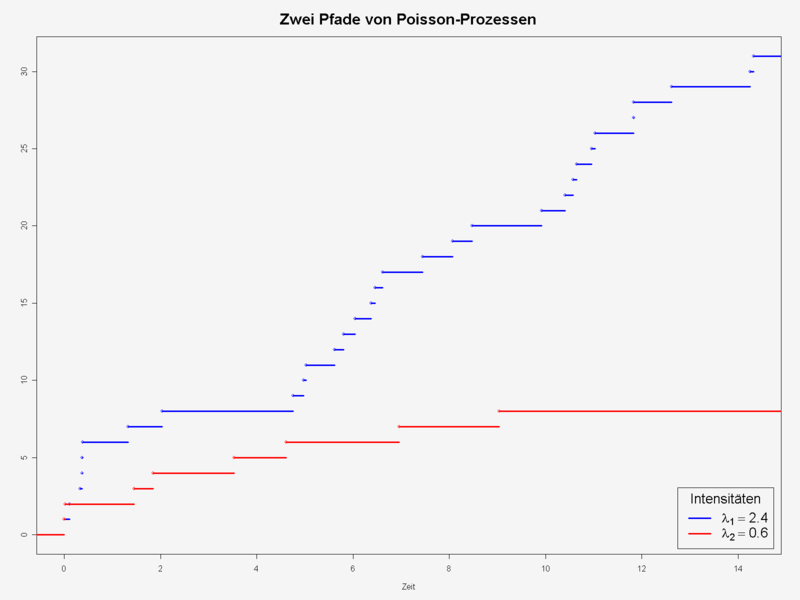
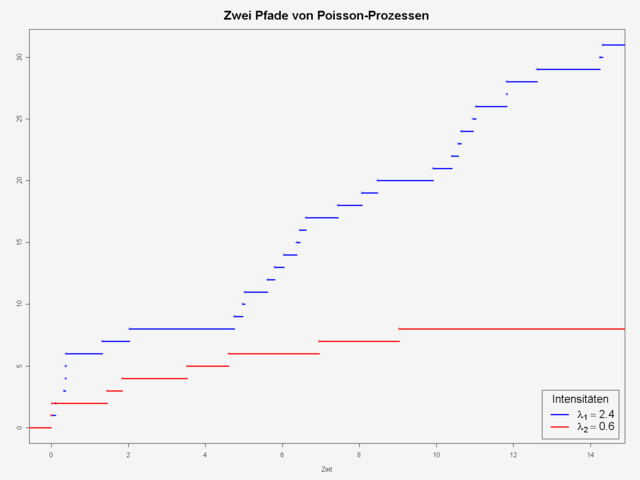
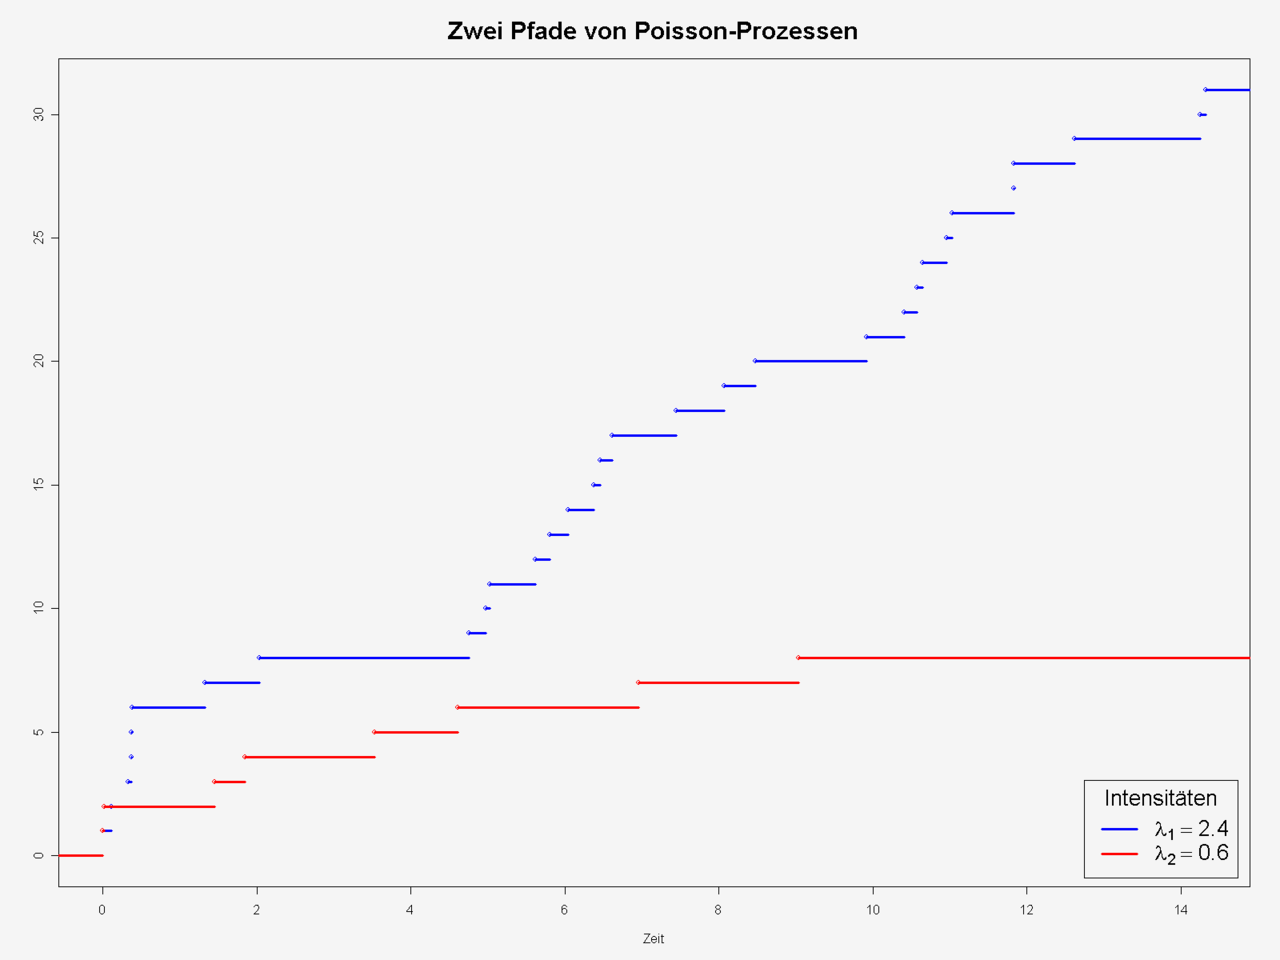
| Description | two trajectories of poisson processes. intensities: 2.4 and 0.6 |
| Date | |
| Source | plot by GNU R, see source below. |
| Author | Thomas Steiner |
| Permission (Reusing this file) |
Thomas Steiner put it under the GFDL |

|
Permission is granted to copy, distribute and/or modify this document under the terms of the GNU Free Documentation License, Version 1.2 or any later version published by the Free Software Foundation; with no Invariant Sections, no Front-Cover Texts, and no Back-Cover Texts. A copy of the license is included in the section entitled GNU Free Documentation License. |
| This file is licensed under the Creative Commons Attribution-Share Alike 3.0 Unported license. | ||
| ||
| This licensing tag was added to this file as part of the GFDL licensing update. |
R-source code:
set.seed(23092006)
n=30
lambda1=2.4
lambda2=0.6
s1=0
s2=0
for (i in 1:n) {
  s1[i+1]=s1[i]+rexp(n=1, rate=lambda1)
  s2[i+1]=s2[i]+rexp(n=1, rate=lambda2)
}
png(filename="Poissonprozess.png", width=1600, height=1200, pointsize=12)
par(bg="whitesmoke")
p1=stepfun(y=seq(0,n+1),x=s1)
p2=stepfun(y=seq(0,n+1),x=s2)
plot.stepfun(x=p1, do.points=TRUE, col.points="blue", col.hor="blue", verticals=FALSE, lwd=3, xlab="Zeit", ylab="", main="", xlim=c(0,max(s1)) )
plot.stepfun(x=p2, do.points=TRUE, col.points="red", col.hor="red",  verticals=FALSE,  lwd=3, add=TRUE, xlim=c(0,max(s1)) )
title(main="Zwei Pfade von Poisson-Prozessen",cex.main=1.9)
legend(x="bottomright", inset=0.01, cex=1.7, title="Intensitäten", legend=c(expression(lambda[1]==2.4,lambda[2]==0.6)), col=c("blue","red"), lwd=3)
dev.off()
File history
Click on a date/time to view the file as it appeared at that time.
| Date/Time | Thumbnail | Dimensions | User | Comment | |
|---|---|---|---|---|---|
| current | 11:57, 23 August 2006 | | 1,600 × 1,200 (9 KB) | Thire (talk | contribs) | better intensities |
| 11:45, 23 August 2006 |  | 1,600 × 1,200 (8 KB) | Thire (talk | contribs) | {{Information| |Description = two trajectories of poisson processes. intensities: 2.5 and 0.6 |Source = plot by GNU R, see source below. |Date = 23 aug 2006 |Author = Thomas Steiner |Permission = [[:de:Benutzer:Thire|Thomas Steiner] |
You cannot overwrite this file.
File usage on Commons
There are no pages that use this file.
File usage on other wikis
The following other wikis use this file:
- Usage on de.wikipedia.org
- Usage on de.wikibooks.org
- Usage on de.wikiversity.org
- Usage on uk.wikipedia.org