File:Quantile meta test.svg
Jump to navigation
Jump to search

Size of this PNG preview of this SVG file: 720 × 540 pixels. Other resolutions: 320 × 240 pixels | 640 × 480 pixels | 1,024 × 768 pixels | 1,280 × 960 pixels | 2,560 × 1,920 pixels.
Original file (SVG file, nominally 720 × 540 pixels, file size: 79 KB)
Captions
Captions
Add a one-line explanation of what this file represents
Summary
[edit]
| Description |
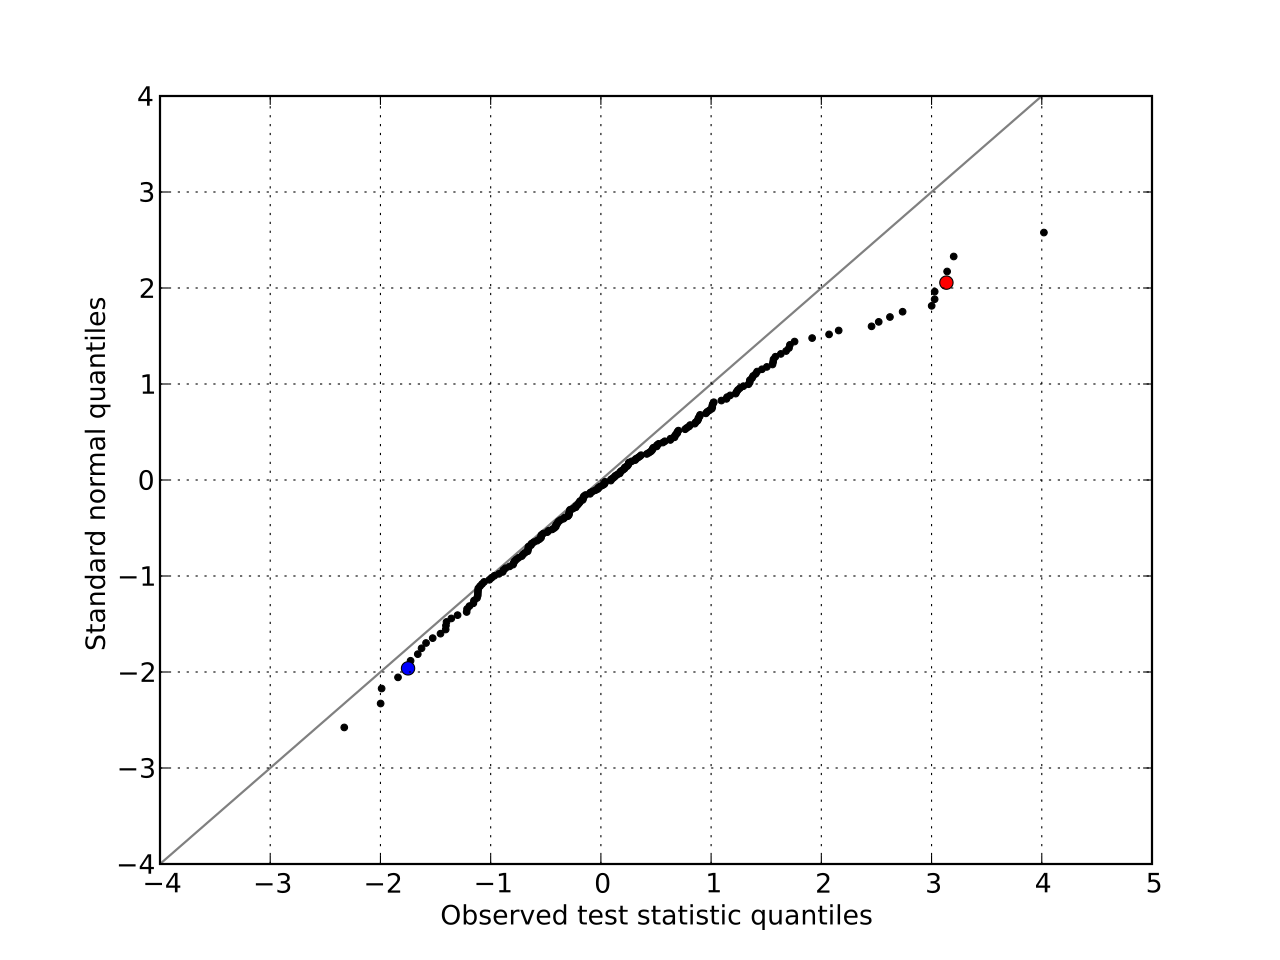
English: Normal quantile plot of test statistics in which the upper tail is heavier than standard normal but the lower tail is not. The red point falls at 3.13,2.06 and the blue point falls at -1.75,-1.96. |
| Date | |
| Source |
Own work |
| Author | Skbkekas |
| SVG development | This plot was created with Matplotlib. |
| Source code | Python codeimport numpy as np
import matplotlib.pyplot as plt
import scipy.special as sp
## Simulate test statistic values.
T = np.random.normal(size=200)
T[0:20] = np.random.normal(size=20)+2
T = np.sort(T)
## Standard normal quantiles.
P = np.arange(1, 201, dtype=np.float64)/201
Q = sp.ndtri(P)
plt.clf()
plt.grid(True)
plt.plot([-4,4], [-4,4], '-', color='grey')
plt.hold(True)
plt.plot(T, Q, 'o', color='black', ms=3)
print T[196],Q[196]
print T[4],Q[4]
plt.plot((T[196],), (Q[196],), 'o', color='red')
plt.plot((T[4],), (Q[4],), 'o', color='blue')
plt.xlabel("Observed test statistic quantiles")
plt.ylabel("Standard normal quantiles")
plt.savefig("quantile_meta_test.png")
plt.savefig("quantile_meta_test.svg")
|
Licensing
[edit]
I, the copyright holder of this work, hereby publish it under the following licenses:

|
Permission is granted to copy, distribute and/or modify this document under the terms of the GNU Free Documentation License, Version 1.2 or any later version published by the Free Software Foundation; with no Invariant Sections, no Front-Cover Texts, and no Back-Cover Texts. A copy of the license is included in the section entitled GNU Free Documentation License. |
| This file is licensed under the Creative Commons Attribution-Share Alike 3.0 Unported license. | ||
| ||
| This licensing tag was added to this file as part of the GFDL licensing update. |
| Copyleft: This work of art is free; you can redistribute it and/or modify it according to terms of the Free Art License. You will find a specimen of this license on the Copyleft Attitude site as well as on other sites. |
You may select the license of your choice.
File history
Click on a date/time to view the file as it appeared at that time.
| Date/Time | Thumbnail | Dimensions | User | Comment | |
|---|---|---|---|---|---|
| current | 03:05, 14 June 2009 | | 720 × 540 (79 KB) | Skbkekas (talk | contribs) | {{Information |Description={{en|1=Normal quantile plot of test statistics in which the upper tail is heavier than standard normal but the lower tail is not. The red point falls at 3.13,2.06 and the blue point falls at -1.75,-1.96.}} |Source=Own work by u |
You cannot overwrite this file.
File usage on Commons
There are no pages that use this file.
File usage on other wikis
The following other wikis use this file:
- Usage on en.wikipedia.org