File:R sin(theta) Surface Plot.png
Jump to navigation
Jump to search

Size of this preview: 740 × 599 pixels. Other resolutions: 296 × 240 pixels | 593 × 480 pixels.
Original file (800 × 648 pixels, file size: 72 KB, MIME type: image/png)
Captions
Captions
Add a one-line explanation of what this file represents
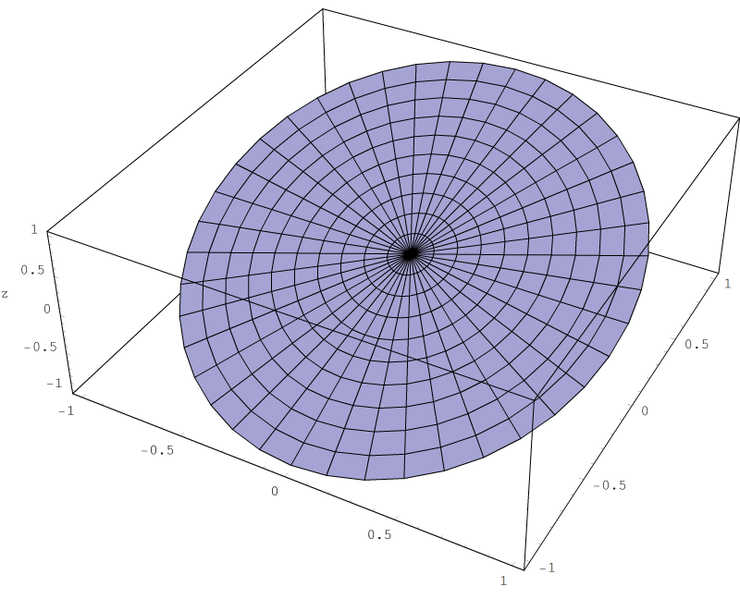
| Description | Polar surface plot of r sin(θ) | ||
| Date | |||
| Source |
self-made This diagram was created with Mathematica. |
||
| Author | Inductiveload | ||
| Permission (Reusing this file) |
|
| Description | Ploar Surface Plot of r sin(θ) |
|---|---|
| Equation | |
| Co-ordinate System | Polar |
| r Range | 0 .. 1 |
| θ Range | -0 .. 2π |

Mathematica Code
[edit]_Surface_Plot.png&action=edit§ion=1)
The rationale for this code can be found on Wikibooks, here. Note the it is slightly modified to allow for antialising.
| This uses Chris Hill's antialiasing code to average pixels and produce a less jagged image. The original code can be found here. | 
|
dtheta = Pi/20;                                     (*Give a radial gridline \
spacing of Pi/20 radians*)
rmax = 1;                                                     (*Define the \
maximum radius*)
dr = rmax/10;                                        (*Give 10 \
circumferential grid lines*)
f[r_, theta_] := r  Sin[theta]; (*This is the function definition*)

data = Table[
      f[r, theta],
      {theta, 0, 2Pi, dtheta},
      {r, 0, rmax, dr}];

gr1 = ListPlot3D[
    data,
    MeshRange -> {{0, rmax}, {0, 2Pi}},
    TextStyle -> {FontSize -> 60},
    BoxStyle -> {AbsoluteThickness[4]},
    MeshStyle -> {AbsoluteThickness[4]},
    AxesLabel -> {"", "", z},
    ImageSize -> 200,
    DisplayFunction -> Identity]

gr2 = Graphics3D[gr1];

substitution = {r_, theta_, z_} -> {r Cos[theta], r Sin[theta], z};
gr3 = ReplaceAll[gr2, p : Polygon[pts_] :> ReplaceAll[p, substitution]]

aa[gr_] := Module[{siz, kersiz, ker, dat, as, ave, is, ar},
    is = ImageSize /. Options[gr, ImageSize];
    ar = AspectRatio /. Options[gr, AspectRatio];
    If[! NumberQ[is], is = 288];
    kersiz = 4;
    img =
    ImportString[ExportString[gr, "PNG", ImageSize -> (is kersiz)], "PNG"];
    siz = Reverse@Dimensions[img[[1, 1]]][[{1, 2}]];
    ker = Table[N[1/kersiz^2], {kersiz}, {kersiz}];
    dat = N[img[[1, 1]]];
    as = Dimensions[dat];
    ave = Partition[Transpose[Flatten[
          ListConvolve[ker, dat[[All, All, #]]]] & /@
            Range[as[[3]]]], as[[2]] - kersiz + 1];
    ave = Take[
    ave, Sequence @@ ({1, Dimensions[ave][[#]], kersiz} & /@ \
Range[Length[Dimensions[ave]] - 1])];
    Show[Graphics[Raster[
      ave, {{0, 0},
         siz/kersiz}, {0, 255}, ColorFunction -> RGBColor]], PlotRange -> \
{{0, siz[[1]]/kersiz}, {0, siz[[2]]/kersiz}}, ImageSize -> is,
    AspectRatio -> ar]
    ]

aa[gr3]
File history
Click on a date/time to view the file as it appeared at that time.
| Date/Time | Thumbnail | Dimensions | User | Comment | |
|---|---|---|---|---|---|
| current | 15:53, 26 August 2007 | | 800 × 648 (72 KB) | Inductiveload (talk | contribs) | |
| 15:05, 26 August 2007 |  | 800 × 648 (100 KB) | Inductiveload (talk | contribs) | {{Information |Description=Polar surface plot of r sin(θ) |Source=self-made {{Mathematica}} |Date=26/08/2007 |Author= Inductiveload |Permission = {{PD-self}} }} {| class=prettytable !colspan=2|[[Image:Icon Mathematical Plot.s |
You cannot overwrite this file.
File usage on Commons
The following page uses this file:
File usage on other wikis
The following other wikis use this file:
- Usage on en.wikibooks.org
_Surface_Plot.png&oldid=467102461)