File:Recent Sea Level Rise.png
Recent_Sea_Level_Rise.png (537 × 373 pixels, file size: 47 KB, MIME type: image/png)
Captions
Captions
Summary
[edit]


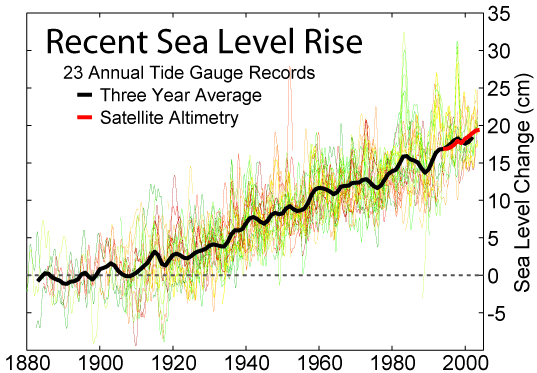
This figure shows the change in annually averaged sea level at 23 geologically stable tide gauge sites with long-term records as selected by Douglas (1997). The thick dark line is a three-year moving average of the instrumental records. These data indicate a sea level rise of ~27.5 cm from 1800-2000. Because of the limited geographic coverage of these records, it is not obvious whether the apparent decadal fluctuations represent true variations in global sea level or merely variations across regions that are not resolved.
For comparison, the recent annually averaged satellite altimetry data [1] from TOPEX/Poseidon are shown in red. These data indicate a somewhat higher rate of increase than tide gauge data, however the source of this discrepancy is not obvious. It may represent systematic error in the satellite record and/or incomplete geographic sampling in the tide gauge record. The month to month scatter on the satellite measurements is roughly the thickness of the plotted red curve.
Data
[edit]
Original data for this figure are from the Permanent Service for Mean Sea Level [2] archive copy at the Wayback Machine (PSMSL). Douglas (1997), defined the following criteria for selecting records from the PSMSL which were long, reliable, and avoided large vertical geologic changes:
- Each record should be at least 60 years in length
- Not be located at collisional plate boundaries
- At least 80% complete
- Show reasonable agreement at low frequencies with nearby gauges sampling the same water mass
- Not be located in regions subject to large post-glacial rebound
He subsequently identified 24 PSMSL records meeting all five of these criteria:
- Auckland, 1903-2000
- Balboa, 1908-1996
- Brest, 1807-2000
- Buenos Aires, Argentina, 1905-1987
- Cascais, 1882-1993
- Cristobal, 1909-1980
- Dunedin, 1900-1998
- Fernandina, 1897-2003
- Genova, 1884-1997
- Honolulu, 1905-2003
- Key West, 1913-2003
- Lagos, 1908-1999
- La Jolla, 1924-2003
- Lyttelton, 1924-2000
- Marseille, 1885-2000
- Newlyn, Cornwall, 1915-2003
- Pensacola, 1923-2003
- Quequen, 1918-1982
- San Diego, 1906-2003
- San Francisco, 1854-2003
- Santa Cruz de Tenerife, 1927-1990
- Santa Monica, 1933-2003
- Trieste, 1905-2001
- Wellington, 1901-1988
After slight corrections following Douglas (1997) for any remaining post-glacial rebound at these sites (typically ~3 cm/century), the tide gauge data from these sites were plotted in no particular order as the thin lines in the above figure. One site, Wellington, was omitted because the author of this figure was unable to locate the corresponding record from the PSMSL.
Copyright
[edit]
This figure was prepared from publicly available data by Robert A. Rohde and is incorporated into the Global Warming Art project.

|
Permission is granted to copy, distribute and/or modify this document under the terms of the GNU Free Documentation License, Version 1.2 or any later version published by the Free Software Foundation; with no Invariant Sections, no Front-Cover Texts, and no Back-Cover Texts. A copy of the license is included in the section entitled GNU Free Documentation License. |
| This file is licensed under the Creative Commons Attribution-Share Alike 3.0 Unported license. | ||
| ||
| This licensing tag was added to this file as part of the GFDL licensing update. |
Reference
[edit]
Bruce C. Douglas (1997). "Global Sea Rise: A Redetermination". Surveys in Geophysics 18: 279–292. DOI:10.1023/A:1006544227856.

|
This geology image could be re-created using vector graphics as an SVG file. This has several advantages; see Commons:Media for cleanup for more information. If an SVG form of this image is available, please upload it and afterwards replace this template with
{{vector version available|new image name}}.
It is recommended to name the SVG file “Recent Sea Level Rise.svg”—then the template Vector version available (or Vva) does not need the new image name parameter. |
File history
Click on a date/time to view the file as it appeared at that time.
| Date/Time | Thumbnail | Dimensions | User | Comment | |
|---|---|---|---|---|---|
| current | 14:49, 26 December 2005 | | 537 × 373 (47 KB) | Angrense (talk | contribs) | Recent changes in seal level. Source:English version of Wikipedia. |
You cannot overwrite this file.
File usage on Commons
The following 5 pages use this file:
File usage on other wikis
The following other wikis use this file:
- Usage on af.wikipedia.org
- Usage on ar.wikipedia.org
- Usage on bg.wikipedia.org
- Usage on cs.wikipedia.org
- Usage on de.wikipedia.org
- Usage on en.wikipedia.org
- Usage on en.wikibooks.org
- Usage on en.wikiversity.org
- Usage on eo.wikipedia.org
- Usage on es.wikipedia.org
- Usage on et.wikipedia.org
- Usage on fr.wikipedia.org
- Usage on gl.wikipedia.org
- Usage on hr.wikipedia.org
- Usage on hu.wikipedia.org
- Usage on id.wikipedia.org
- Usage on ja.wikipedia.org
- Usage on jv.wikipedia.org
- Usage on ko.wikipedia.org
- Usage on li.wikipedia.org
- Usage on ml.wikipedia.org
- Usage on ms.wikipedia.org
- Usage on nl.wikipedia.org
- Usage on no.wikipedia.org
- Usage on pl.wikipedia.org
- Usage on pt.wikipedia.org
- Usage on rue.wikipedia.org
View more global usage of this file.