File:Sunspot Numbers-fr.svg

Original file (SVG file, nominally 1,000 × 425 pixels, file size: 64 KB)
Captions
Captions
Summary
[edit]| Description |
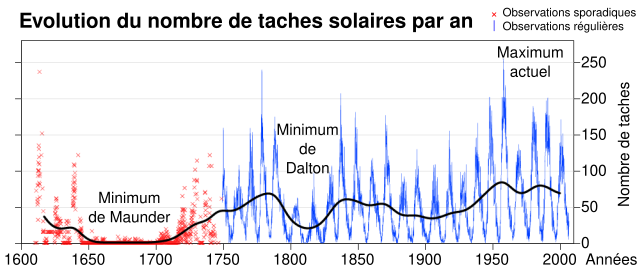
English: Number of sunspots between 1600 and 2000.
 This figure summarizes sunspot number observations. Since c. 1749, continuous monthly averages of sunspot activity have been available and are shown here as reported by the Solar Influences Data Analysis Center, World Data Center for the Sunspot Index, at the Royal Observatory of Belgium. These figures are based on an average of measurements from many different observatories around the world. Prior to 1749, sporadic observations of sunspots are available. These were compiled and placed on consistent monthly framework by Hoyt & Schatten (1998a, 1998b). The most prominent feature of this graph is the c. 11 year solar magnetic cycle which is associated with the natural waxing and waning of solar activity. On longer time scales, the sun has shown considerable variability, including the long Maunder Minimum when almost no sunspots were observed, the less severe Dalton Minimum, and increased sunspot activity during the last fifty years, known as the Modern Maximum. The causes for these variations are not well understood, but because sunspots and associated faculae affect the brightness of the sun, solar luminosity is lower during periods of low sunspot activity. It is widely believed that the low solar activity during the Maunder Minimum and earlier periods may be among the principal causes of the Little Ice Age. Similarly, the Modern Maximum is partly responsible for global warming, especially the temperature increases between 1900 and 1950. One study (Stott et al. 2003), argues that residual warming due to the sustained high level of activity since 1950 is responsible for 16 to 36% of recent warming while "most warming over the last 50 yrs is likely to have been caused by increases in greenhouse gases."Français : Nombre de taches solaires entre 1600 et 2000.
Ce graphique présente les observations du nombre de taches solaires par an. Depuis 1749, les observations de moyennes mensuelles d'activité des taches solaires ont été continues, et sont présentés ici comme indiqué par le Solar Influences Data Analysis Center, centre mondial de données pour l'indice des taches solaires, à l'Observatoire Royal de Belgique. Ces chiffres sont basés sur une moyenne de mesures à partir de plusieurs observatoires à travers le monde. Avant 1749, certaines observations sporadiques de taches solaires sont disponibles. Elles ont été compilées et placées dans le cadre mensuel conforme de Hoyt et Schatten (1998a, 1998b). La principale caractéristique de ce graphique est le cycle magnétique solaire de 11 années, qui est associé à la croissance et au déclin de l'activité solaire. Sur des échelles de temps plus longues, le soleil a montré une variabilité considérable, y compris le long Minimum de Maunder où presque pas de taches solaires ont été observées, le Minimum de Dalton, et l'augmentation de l'activité des taches solaires au cours des cinquante dernières années, connu sous le nom de maximum moderne. Les causes de ces variations ne sont pas bien comprises, mais à cause des taches solaires et des faculæ associées, la luminosité solaire est plus faible pendant les périodes de faible activité des taches solaires. Il est largement admis que la faible activité solaire pendant le minimum de Maunder et les périodes antérieures peuvent être parmi les causes principales du petit âge glaciaire. De même, le maximum moderne est en partie responsable du réchauffement planétaire, en particulier l'augmentation de température entre 1900 et 1950. Une étude (Stott et al. 2003) affirme que le réchauffement résiduel, en raison du niveau élevé et soutenu de l'activité depuis 1950, est responsable de 16% à 36% du réchauffement récent alors que « la plupart du réchauffement au cours des 50 dernières ans est susceptible d'avoir été causé par l'augmentation des gaz à effet de serre. » |
| Date | Sémhur |
| Source | |
| Author |
|
| Other versions |
|
| Attribution (required by the license) | © Sémhur / Wikimedia Commons / |
| SVG | W3C-validity not checked. |
| Graphic Lab |

Licensing
[edit]
This figure was prepared by Robert A. Rohde and is part of the Global Warming Art project.

|
Permission is granted to copy, distribute and/or modify this document under the terms of the GNU Free Documentation License, Version 1.2 or any later version published by the Free Software Foundation; with no Invariant Sections, no Front-Cover Texts, and no Back-Cover Texts. A copy of the license is included in the section entitled GNU Free Documentation License. |
| This file is licensed under the Creative Commons Attribution-Share Alike 3.0 Unported license. | ||
| ||
| This licensing tag was added to this file as part of the GFDL licensing update. |
References
[edit]
- Hoyt, D. V., and K. H. Schatten (1998a). "Group sunspot numbers: A new solar activity reconstruction. Part 1.". Solar Physics 179: 189-219.
- Hoyt, D. V., and K. H. Schatten (1998b). "Group sunspot numbers: A new solar activity reconstruction. Part 2.". Solar Physics 181: 491-512.
- Stott, Peter A.; Gareth S. Jones and John F. B. Mitchell (15 December 2003). "Do Models Underestimate the Solar Contribution to Recent Climate Change". Journal of Climate 16: 4079-4093.
File history
Click on a date/time to view the file as it appeared at that time.
| Date/Time | Thumbnail | Dimensions | User | Comment | |
|---|---|---|---|---|---|
| current | 10:46, 9 August 2009 | | 1,000 × 425 (64 KB) | Sémhur (talk | contribs) | years centered |
| 18:43, 5 August 2009 |  | 1,000 × 425 (61 KB) | Sémhur (talk | contribs) | == {{int:filedesc}} == {{Information |Description= {{en|1=Number of sunspots between 1600 and 2000.}} {{fr|1=Nombre de taches solaires entre 1600 et 2000.}} |Source= *[http://www.globalwarmingart.com/wiki/Image:Suns |
You cannot overwrite this file.
File usage on Commons
There are no pages that use this file.
File usage on other wikis
The following other wikis use this file:
- Usage on fr.wikipedia.org
- Usage on ro.wikipedia.org